data projects
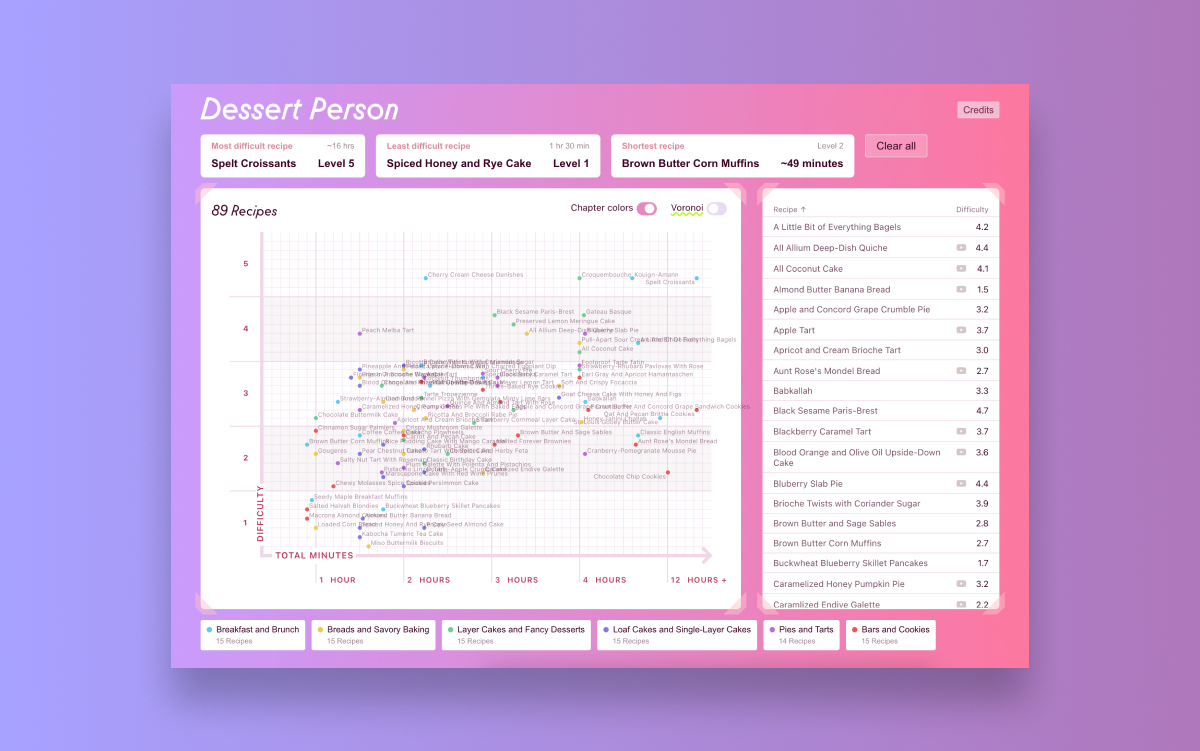
Dessert Person | Interactive Visualization
The Dessert Person cookbook (by Claire Saffitz and designed by Mia Johnson) features this recipe difficulty x cook time scatterplot.
Vue + D3 Visualization Starter | Mass Shooters & Global Temps
Here, take some code.
Kicked off as my
Black lives matter. Abortion is healthcare. Climate change is real. Support prison reform. 🙏
Evaluating Mass School Shooter Ages*For tragedies resulting in at least one death.
I would like to update this with a dataset for all shootings, not just events resulting in fatalities.
For tragedies resulting in at least one death.
I would like to update this with a dataset for all shootings, not just events resulting in fatalities.
USA, 1982 – 2022
Has the Earth always been this hot?
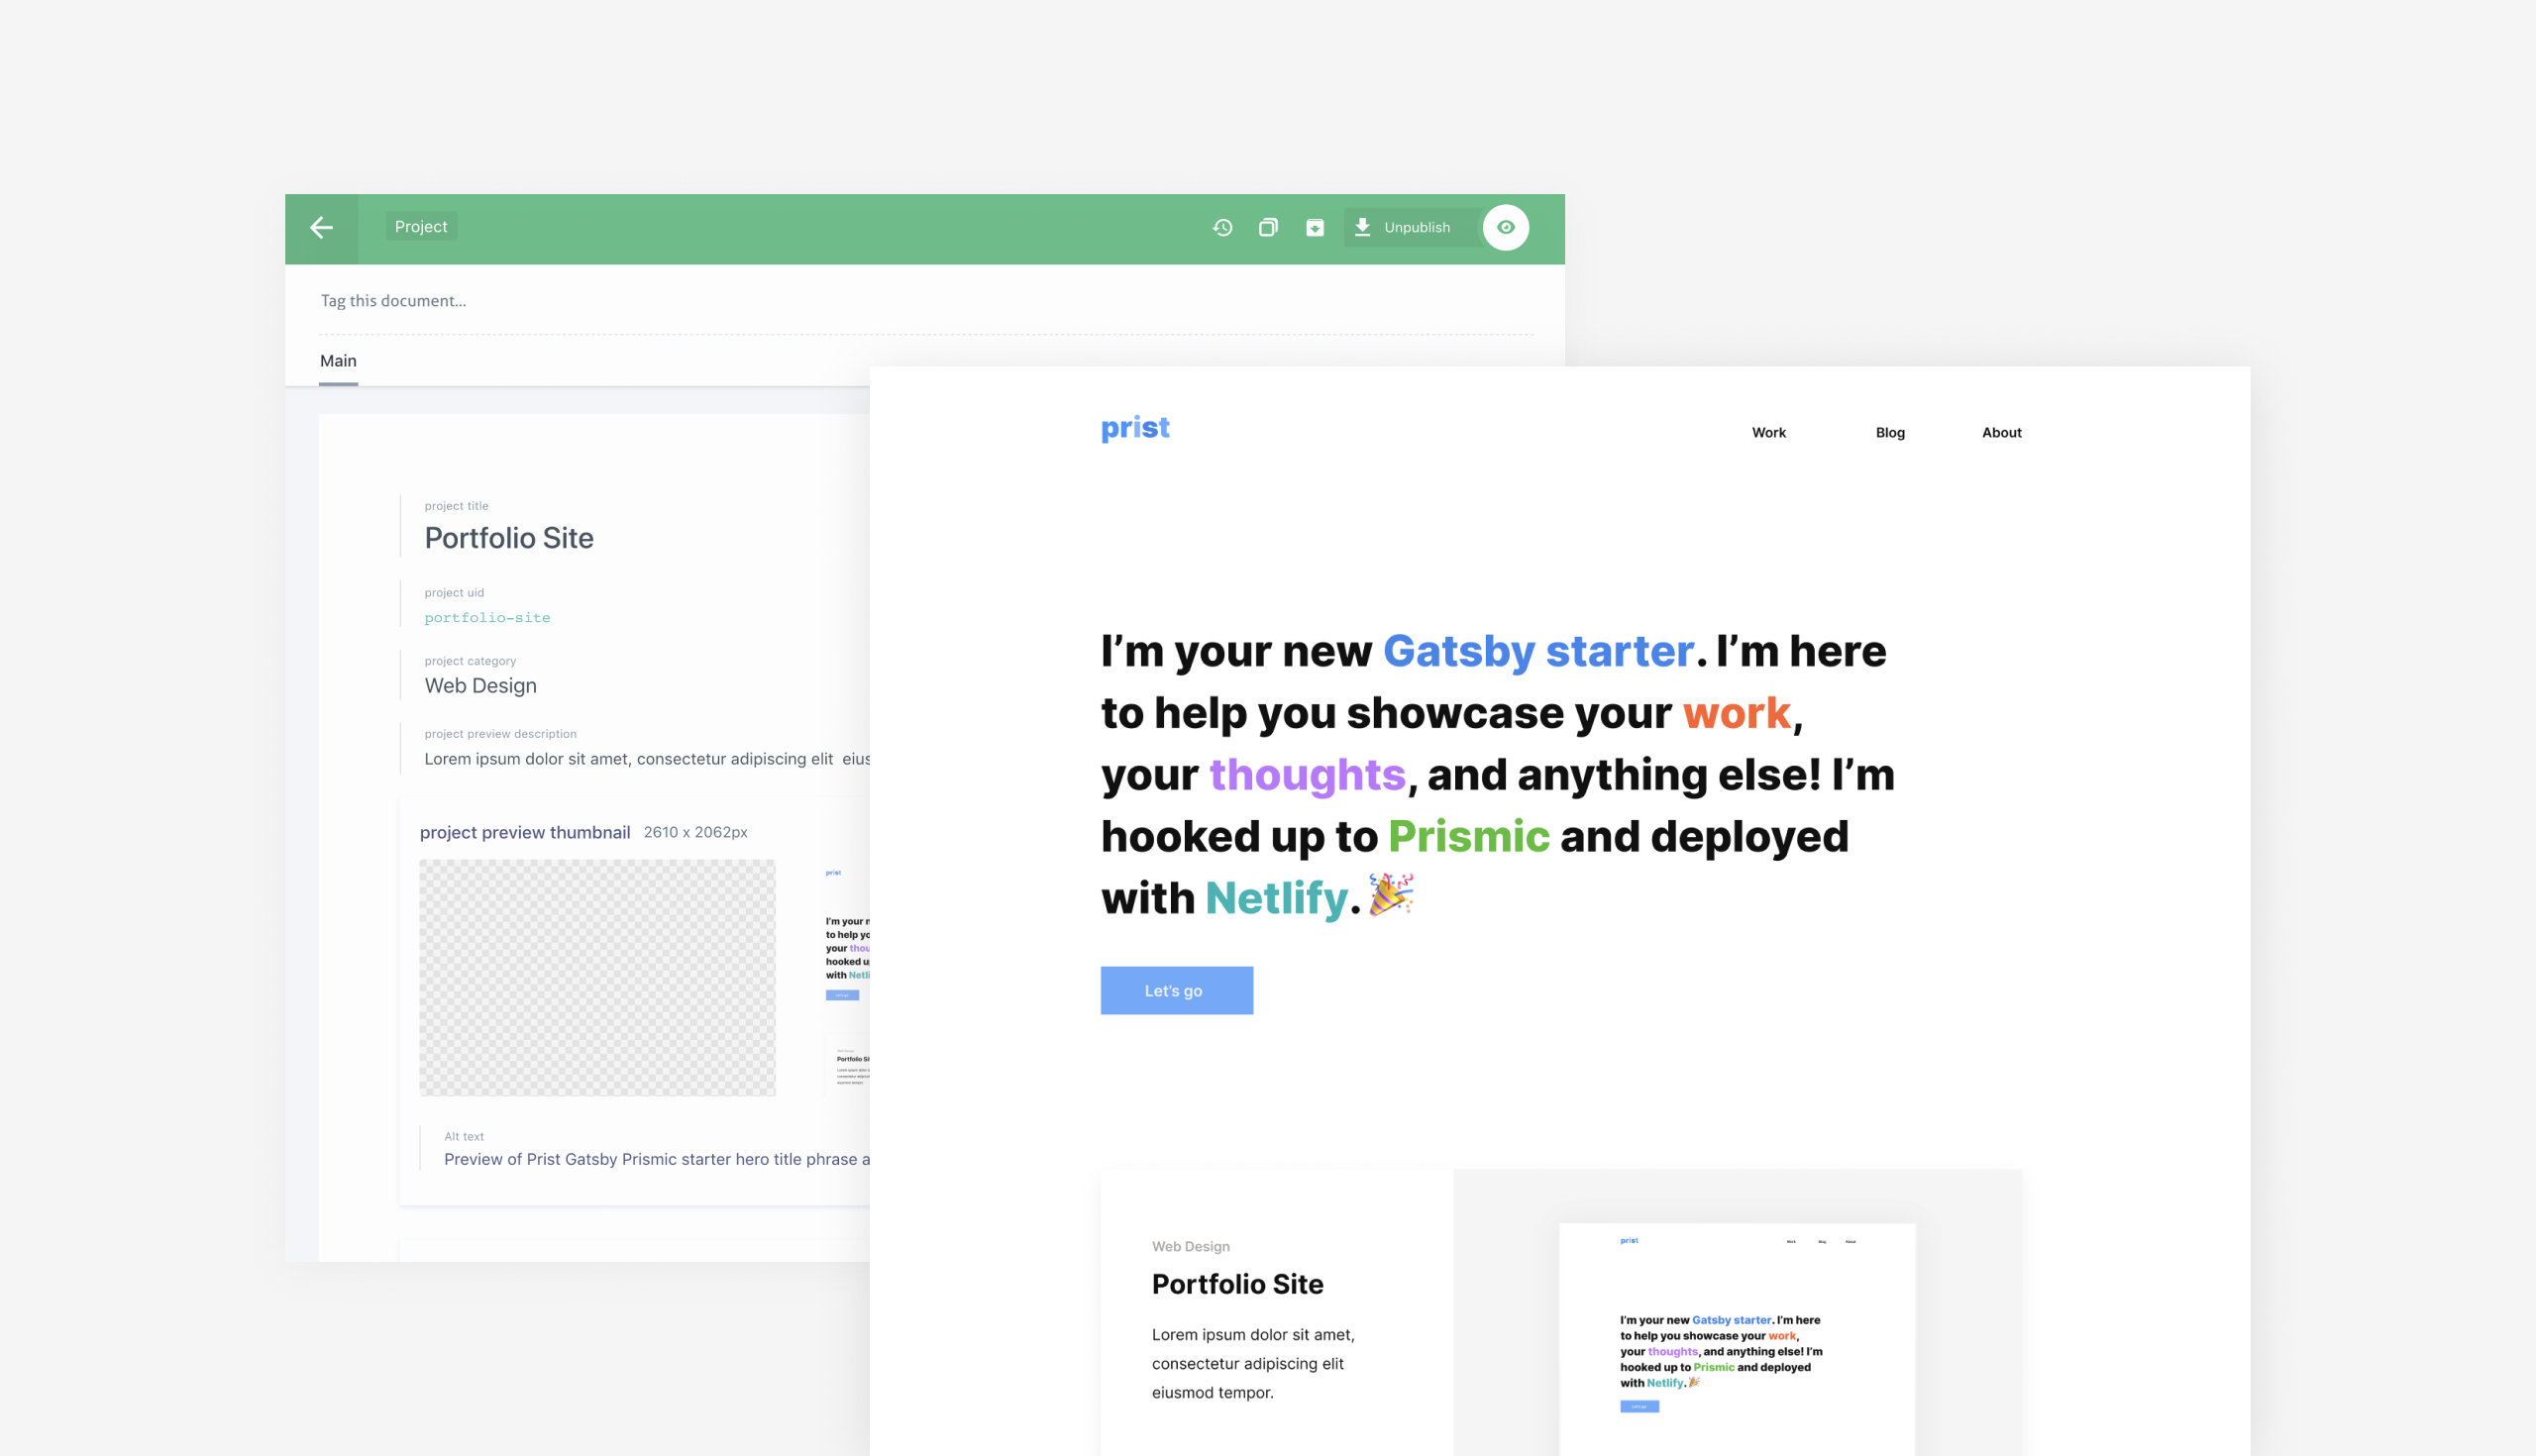
Prist | A Gatsby & Prismic Starter
A light-themed starter powered by Gatsby and Prismic to showcase portfolios and blogs.
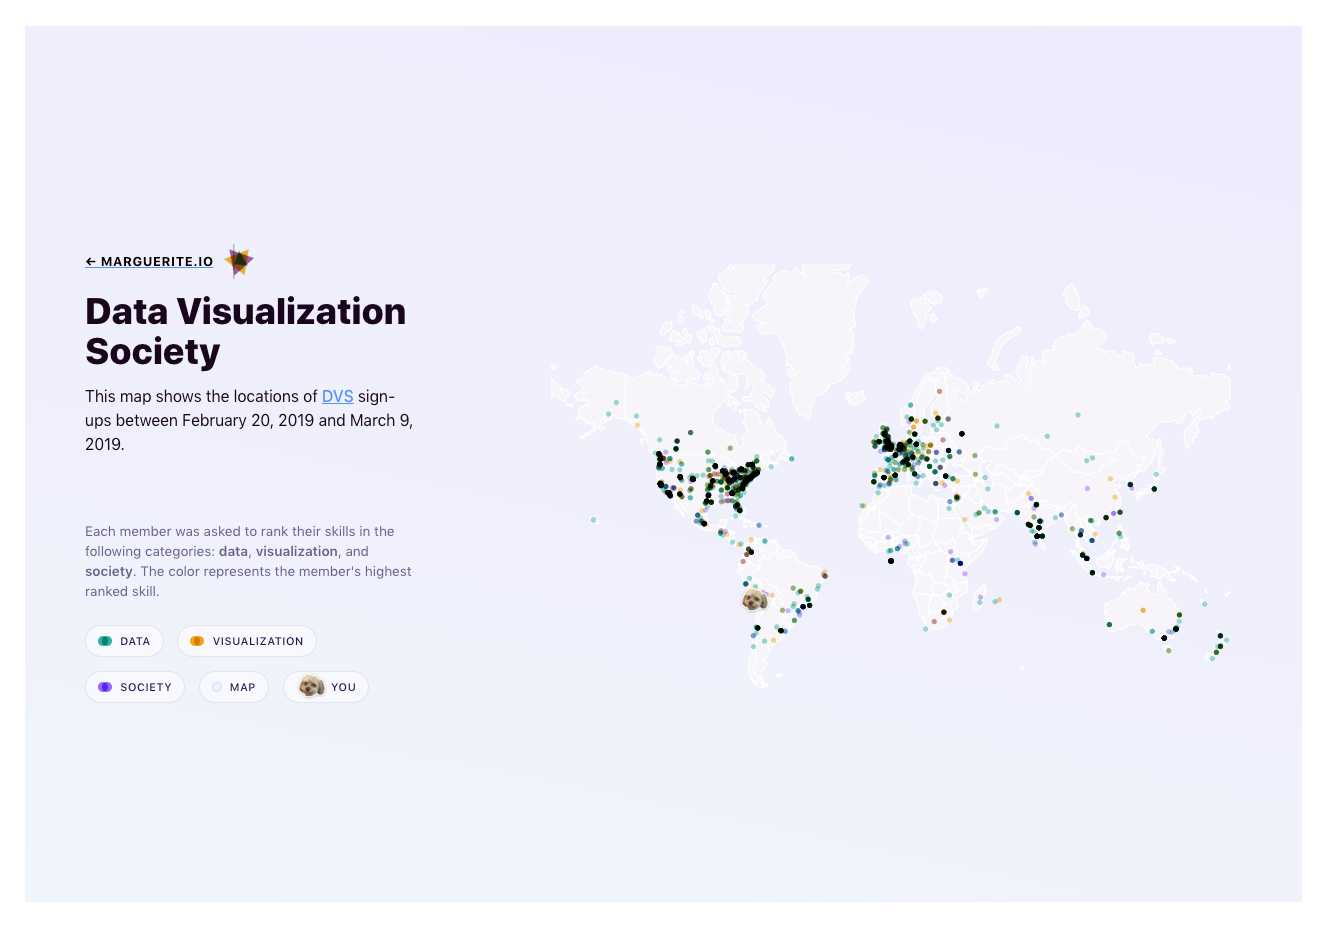
Data Visualization Society Member Map
The Data Visualization Society asked members to rank their skills in the following categories: data, visualization, and society.
I mapped the location of each member with the ability to filter by their highest ranked skill to show the distribution of each around the world.
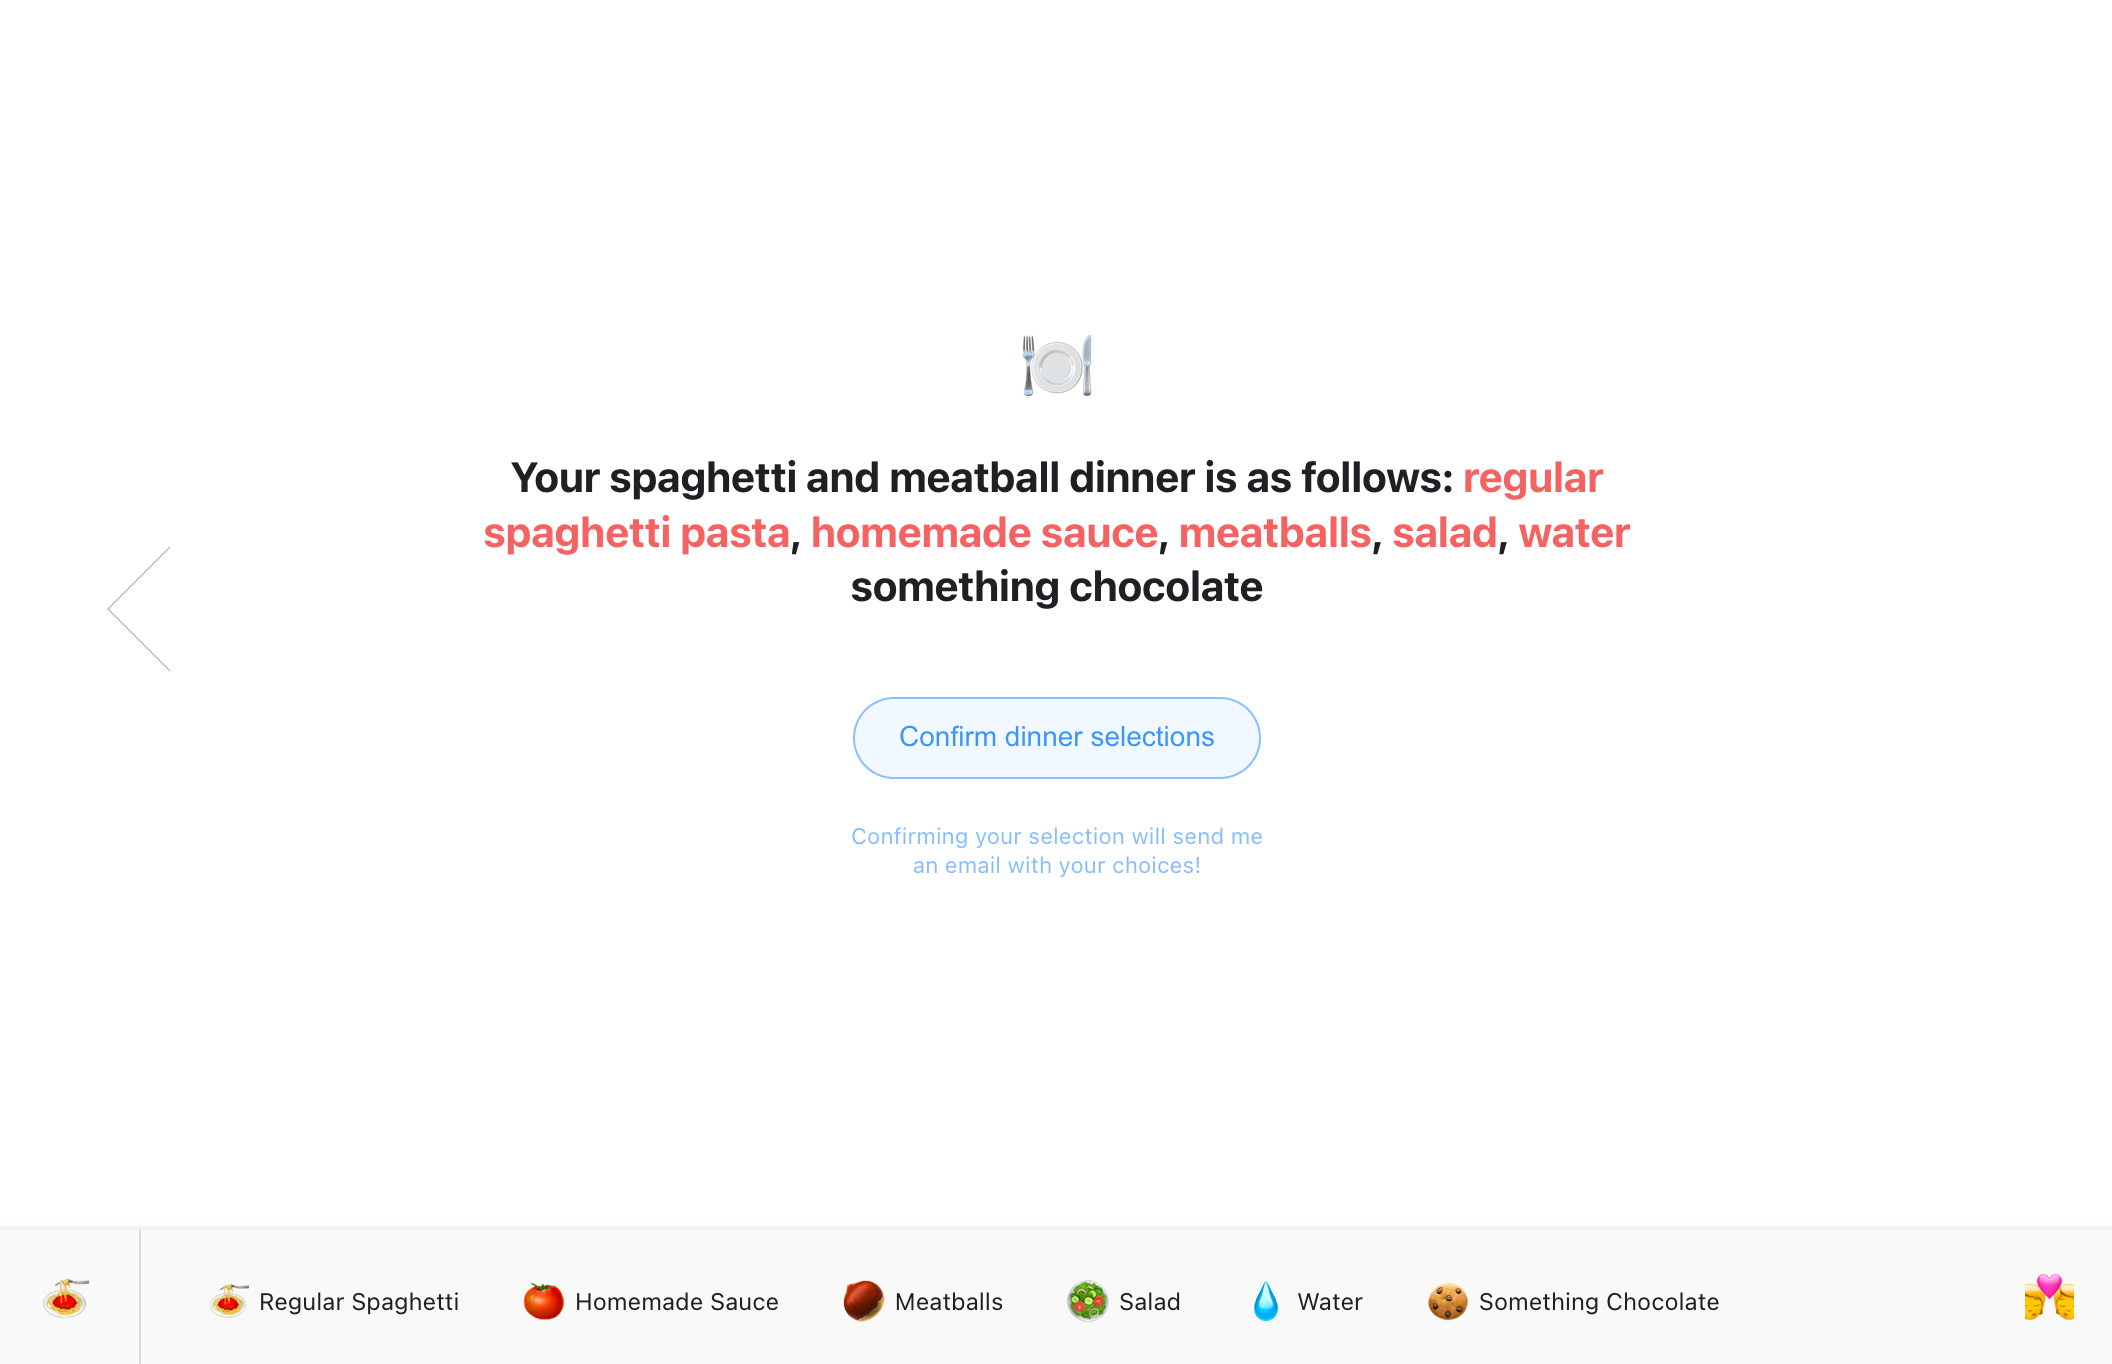
Albondiga
Very first React project way-back-when. I keep it around because it makes me happy.
I developed this project as a birthday gift for my partner — a lover of spaghetti and meatballs. The recipient can pick the ingredients making up a spaghetti and meatballs dinner: pasta type, sauce, drinks, etc.
