Goals: New feature exploration and development
Targets
- Scope and create Goal setting feature v1
- Co-lead discovery and user feedback sessions
- Elasticsearch, Django, JavaScript, Vue, D3, Figma
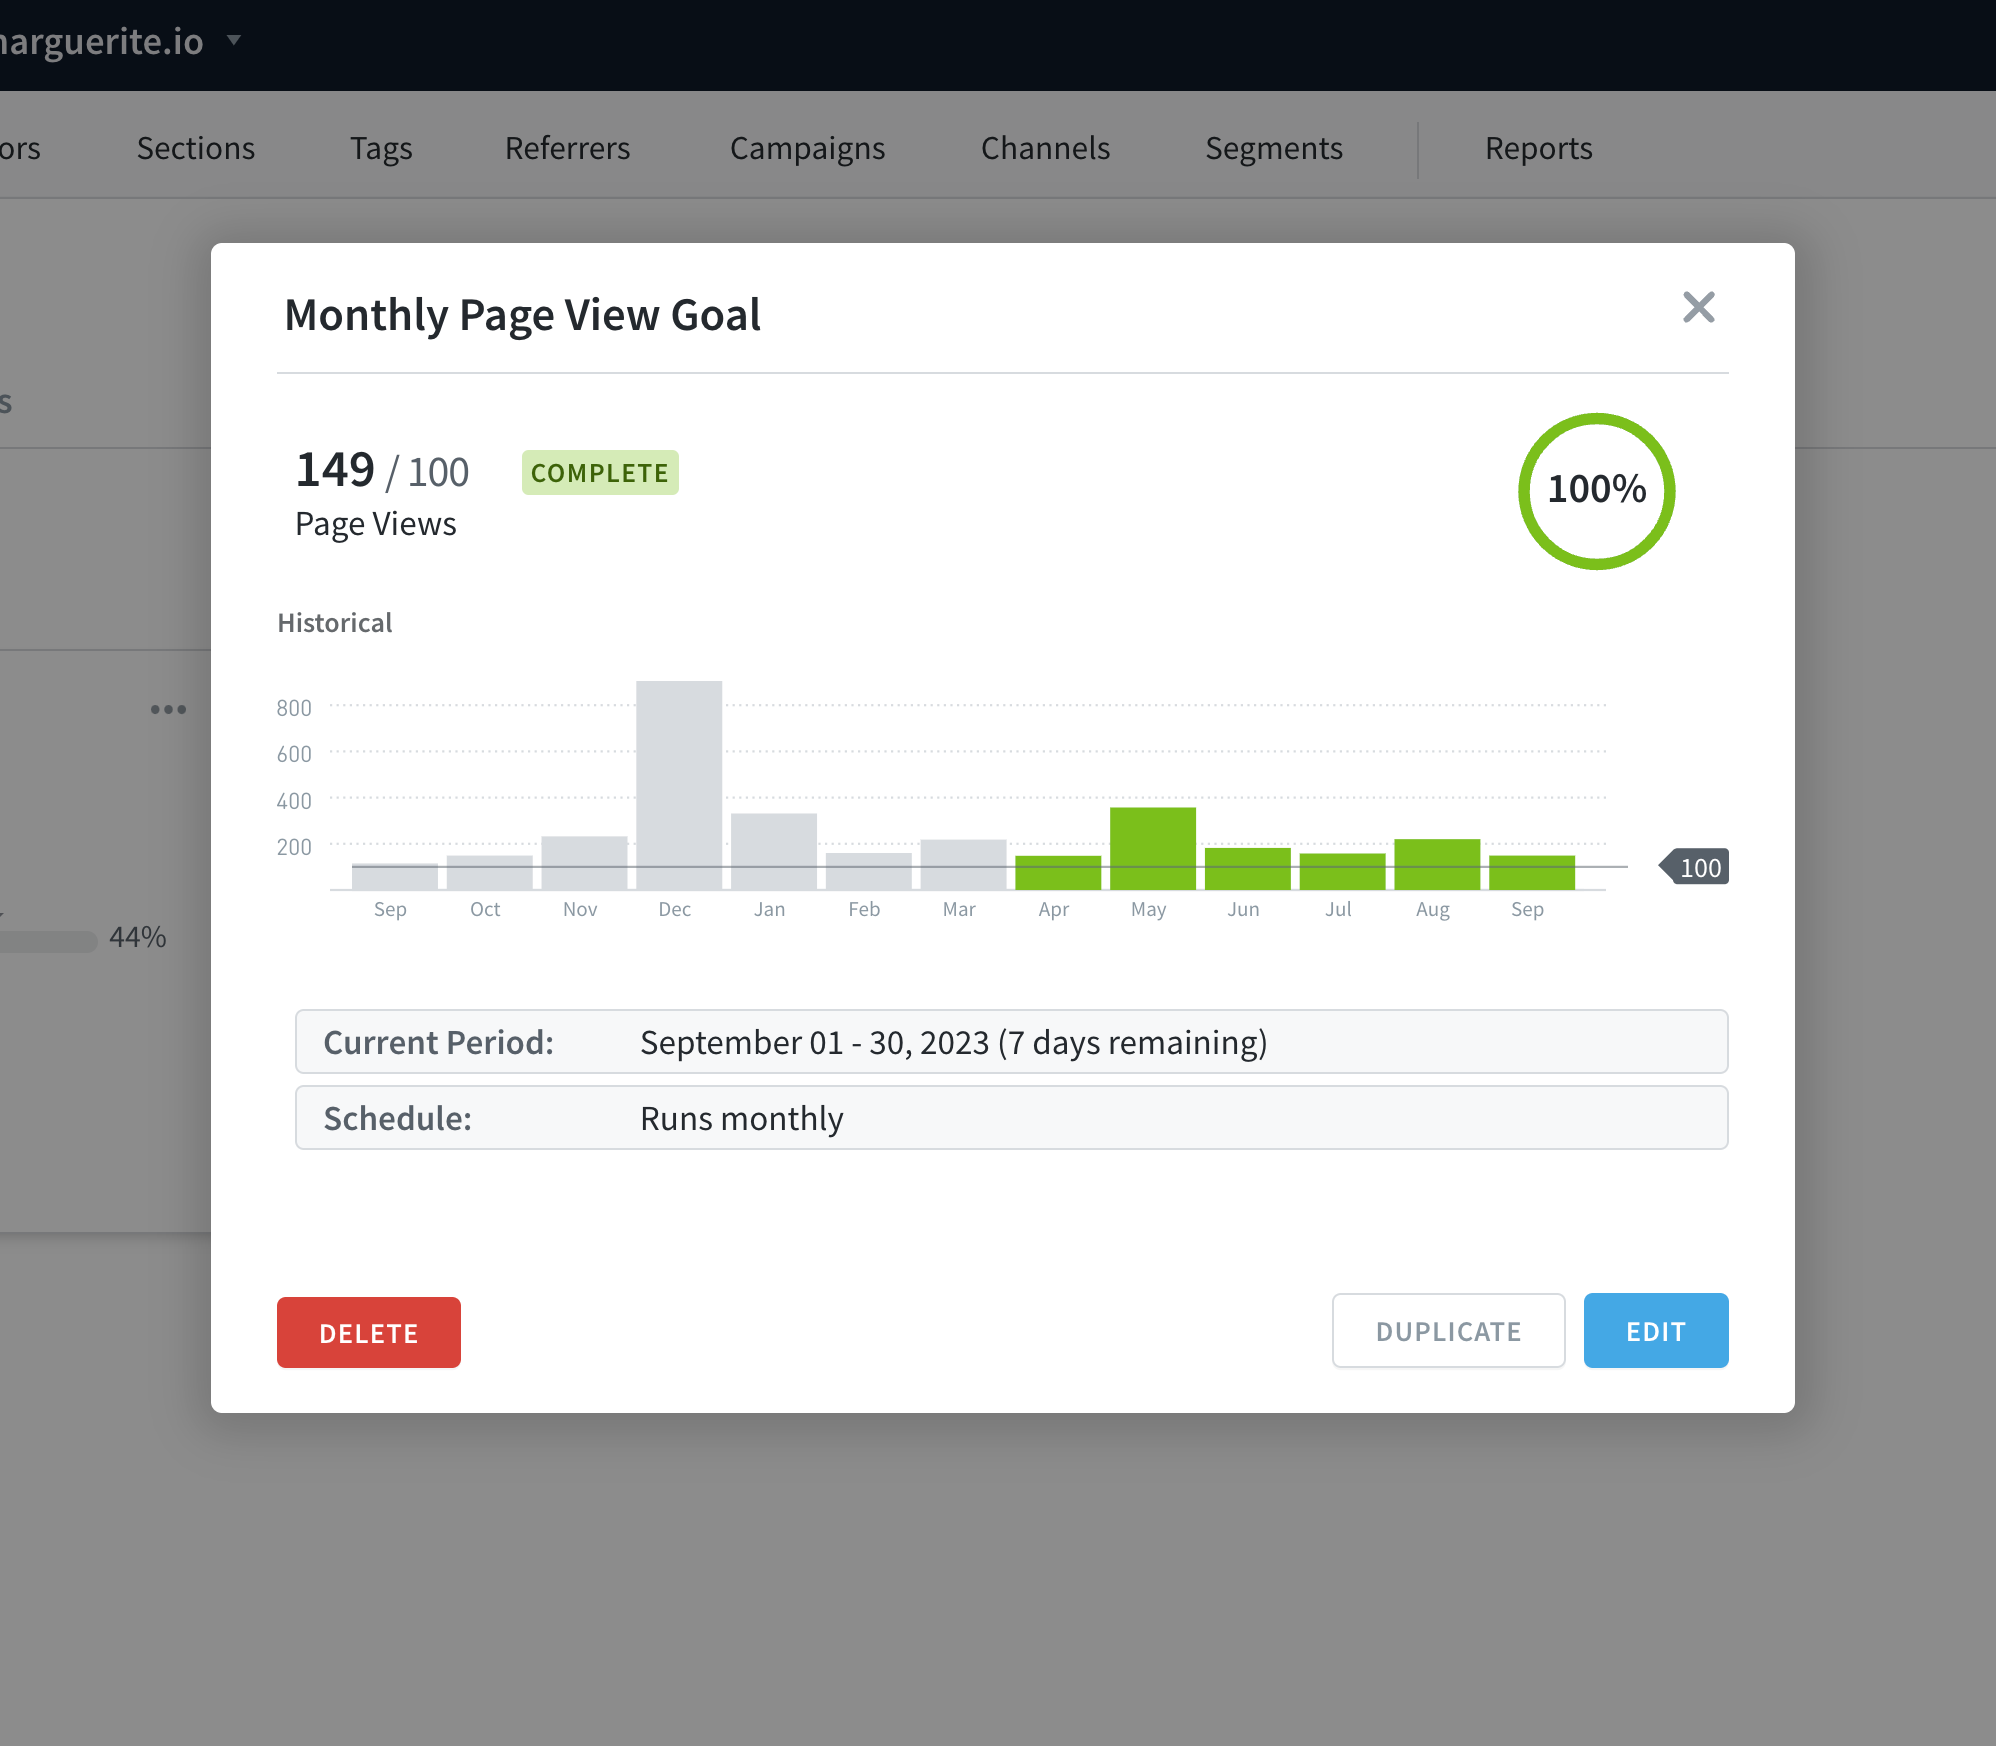
This dashboard feature allows account admins to set company-wide goals around content performance. Users can track by page views, device, and referrer.
The post-beta update of this feature included a more robust goal setting UI, allowing users to set goals based on historical performance. This feature continues to be improved.
Google Search Console integration: SEO feature expansion
Targets
- Help journalists and marketing teams better understand how their content performs on Search and Discover
- Co-lead discovery and user feedback sessions
- Rapidly prototype with beta testers
- Launch in 4 months
- Django, Python, Google Console, OAuth, JavaScript, Vue, Figma
- ~ Since launch, this has been our most popular beta integration to date. Extensive waitlist.
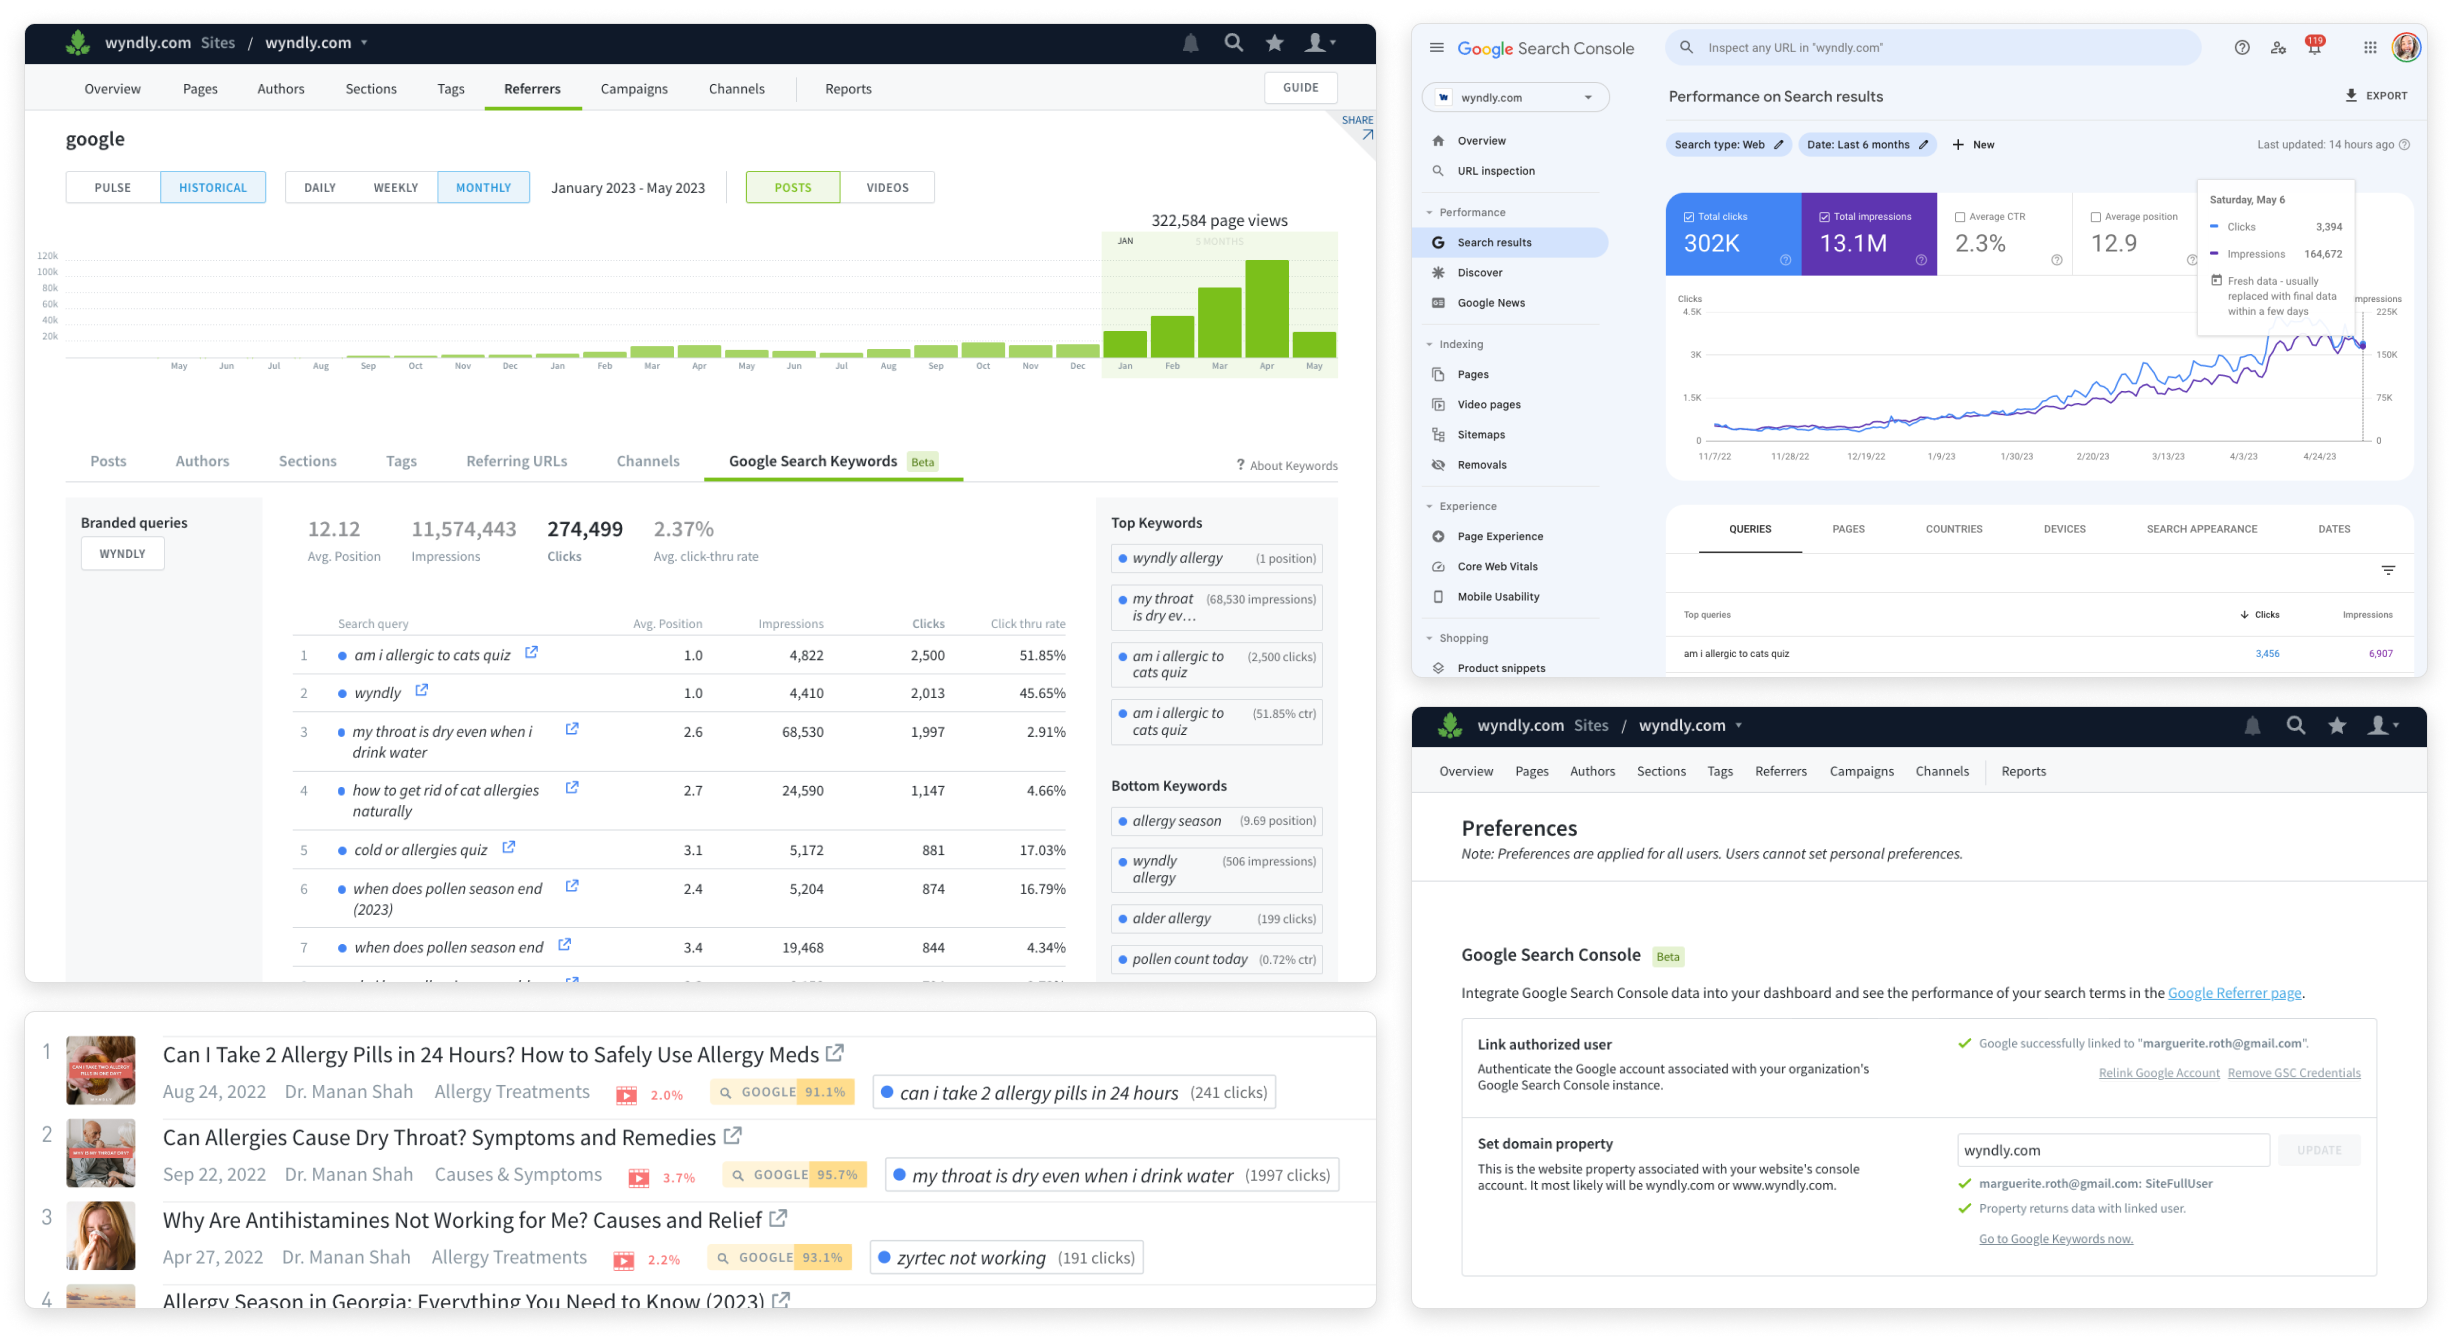
We were tasked to improve our SEO feature offering. One area of exploration was with Google Search Console — an integration highly demanded by our customers but also a high-risk and unknown development area for our team.
I led the Frontend team working on this feature, bringing Search Console and Discover data to the dashboard (beta). This experimental project encompassed learning about Google Console, implementing OAuth flows, handling edge case integrations (some Google Console accounts are 10+ years old), and designing and implementing console data dashboard features and static reports.
Surfacing network insights with content syndication UI and data
Targets
- Fix, validate, and aggregate network data
- Improve UI and dashboard areas this touches — Post and Listings
- Create more informative tooltips
- Elasticsearch, Django, JavaScript, Vue, D3, Figma
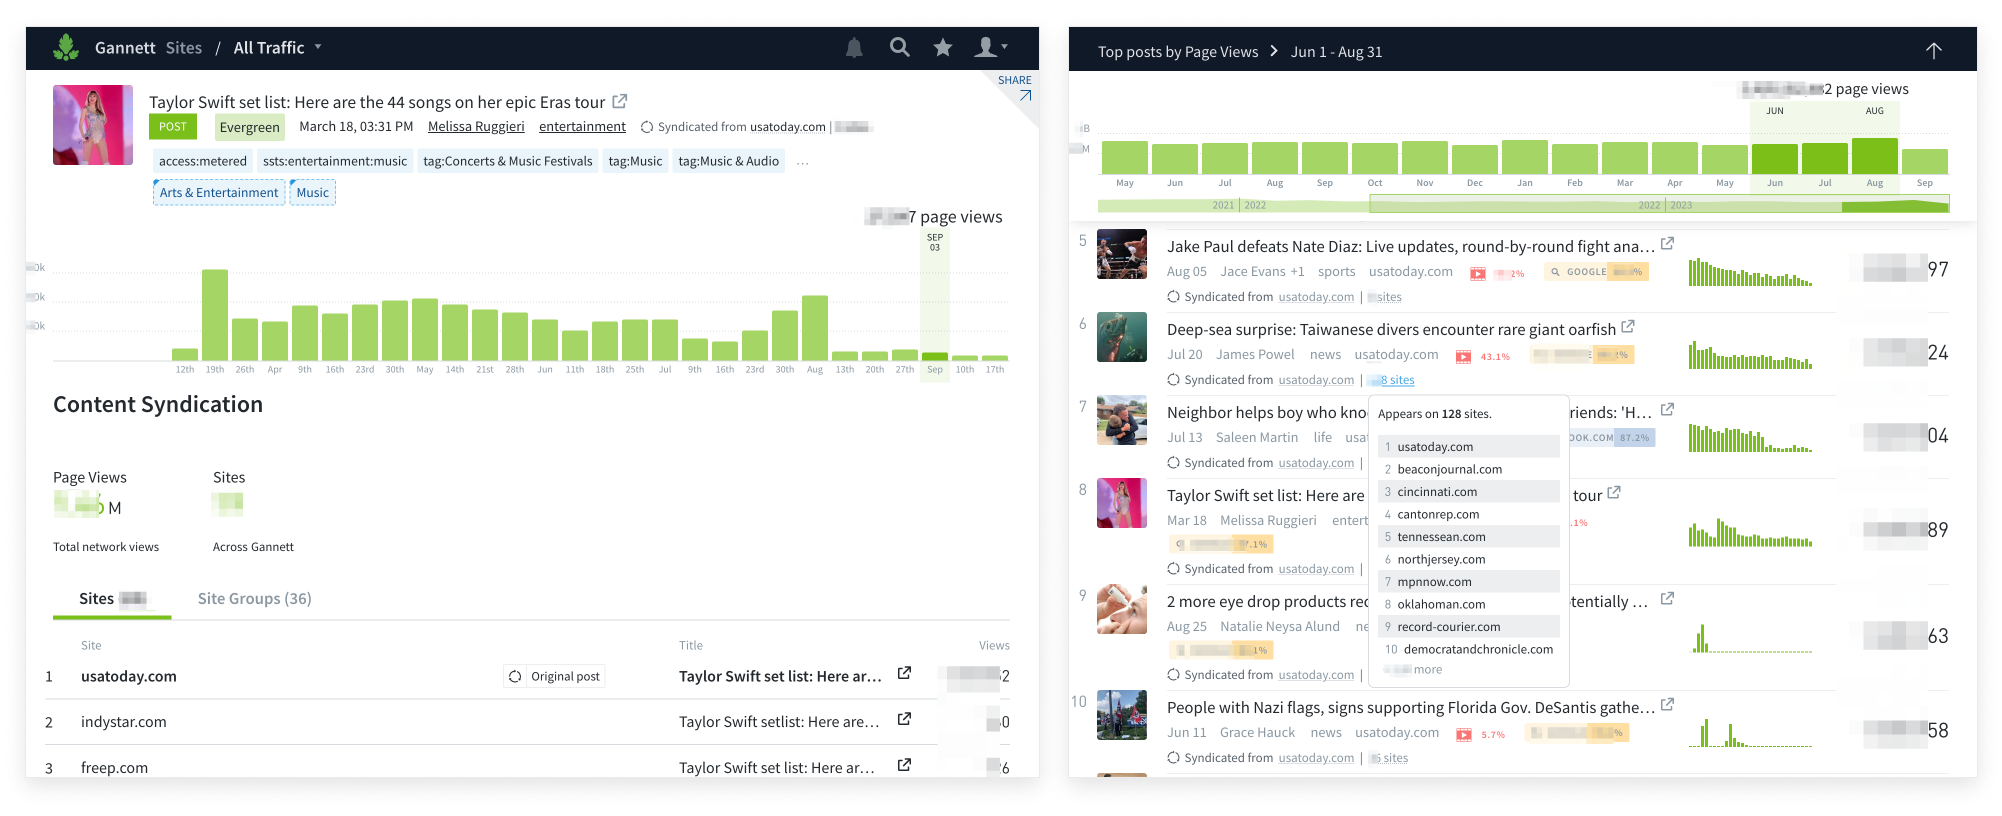
I inherited the syndication feature when tackling data bug fixes. Publishing companies use this information when viewing data at a network level (if MagazineNewsCorp published one piece across many sites.) With a product manager, I updated the network-level Post page (information about an article) and Listing pages (e.g., top posts). This project involved investigating and learning about this data area, creating new and more robust queries, organizing data for frontend API, and implementing and iterating through improved designs.
Currents
Read about the time we made an experimental aggregated-data dashboard called Currents. Though it has since been shut down, the Product Hunt entry lives on — 241 upvotes!


