Generated PDF test results for allergy patients and doctors
Target 🎯
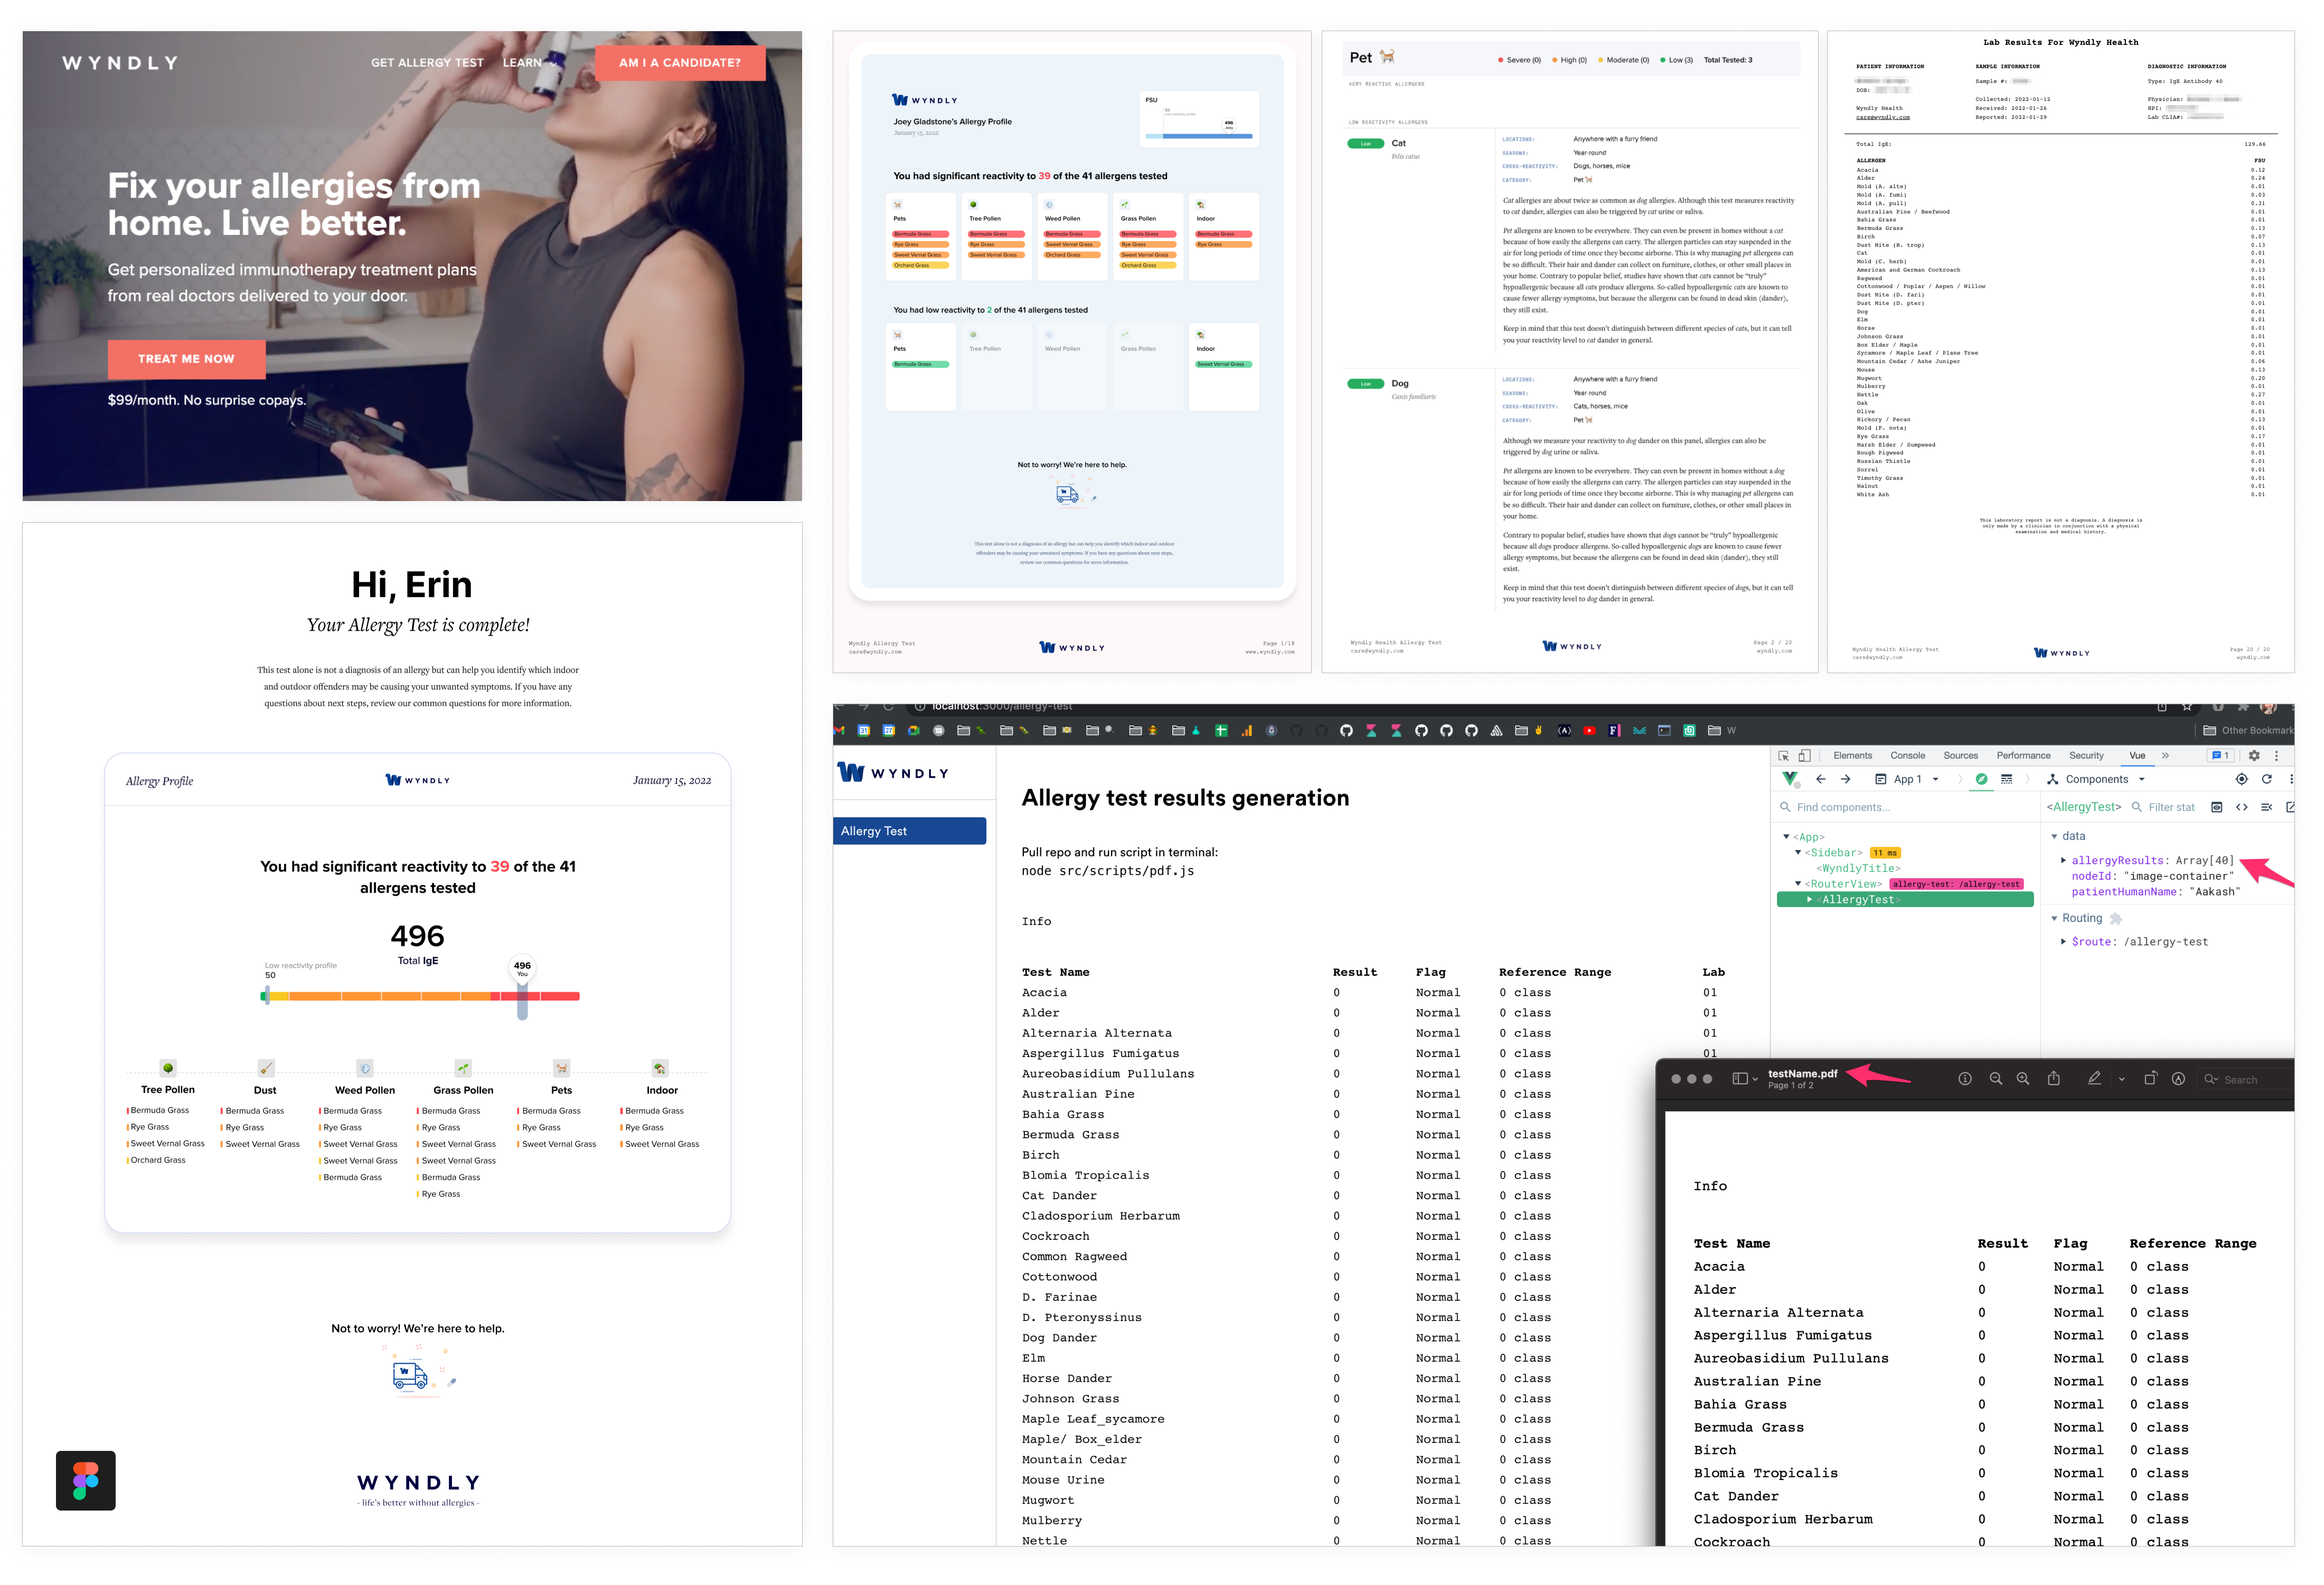
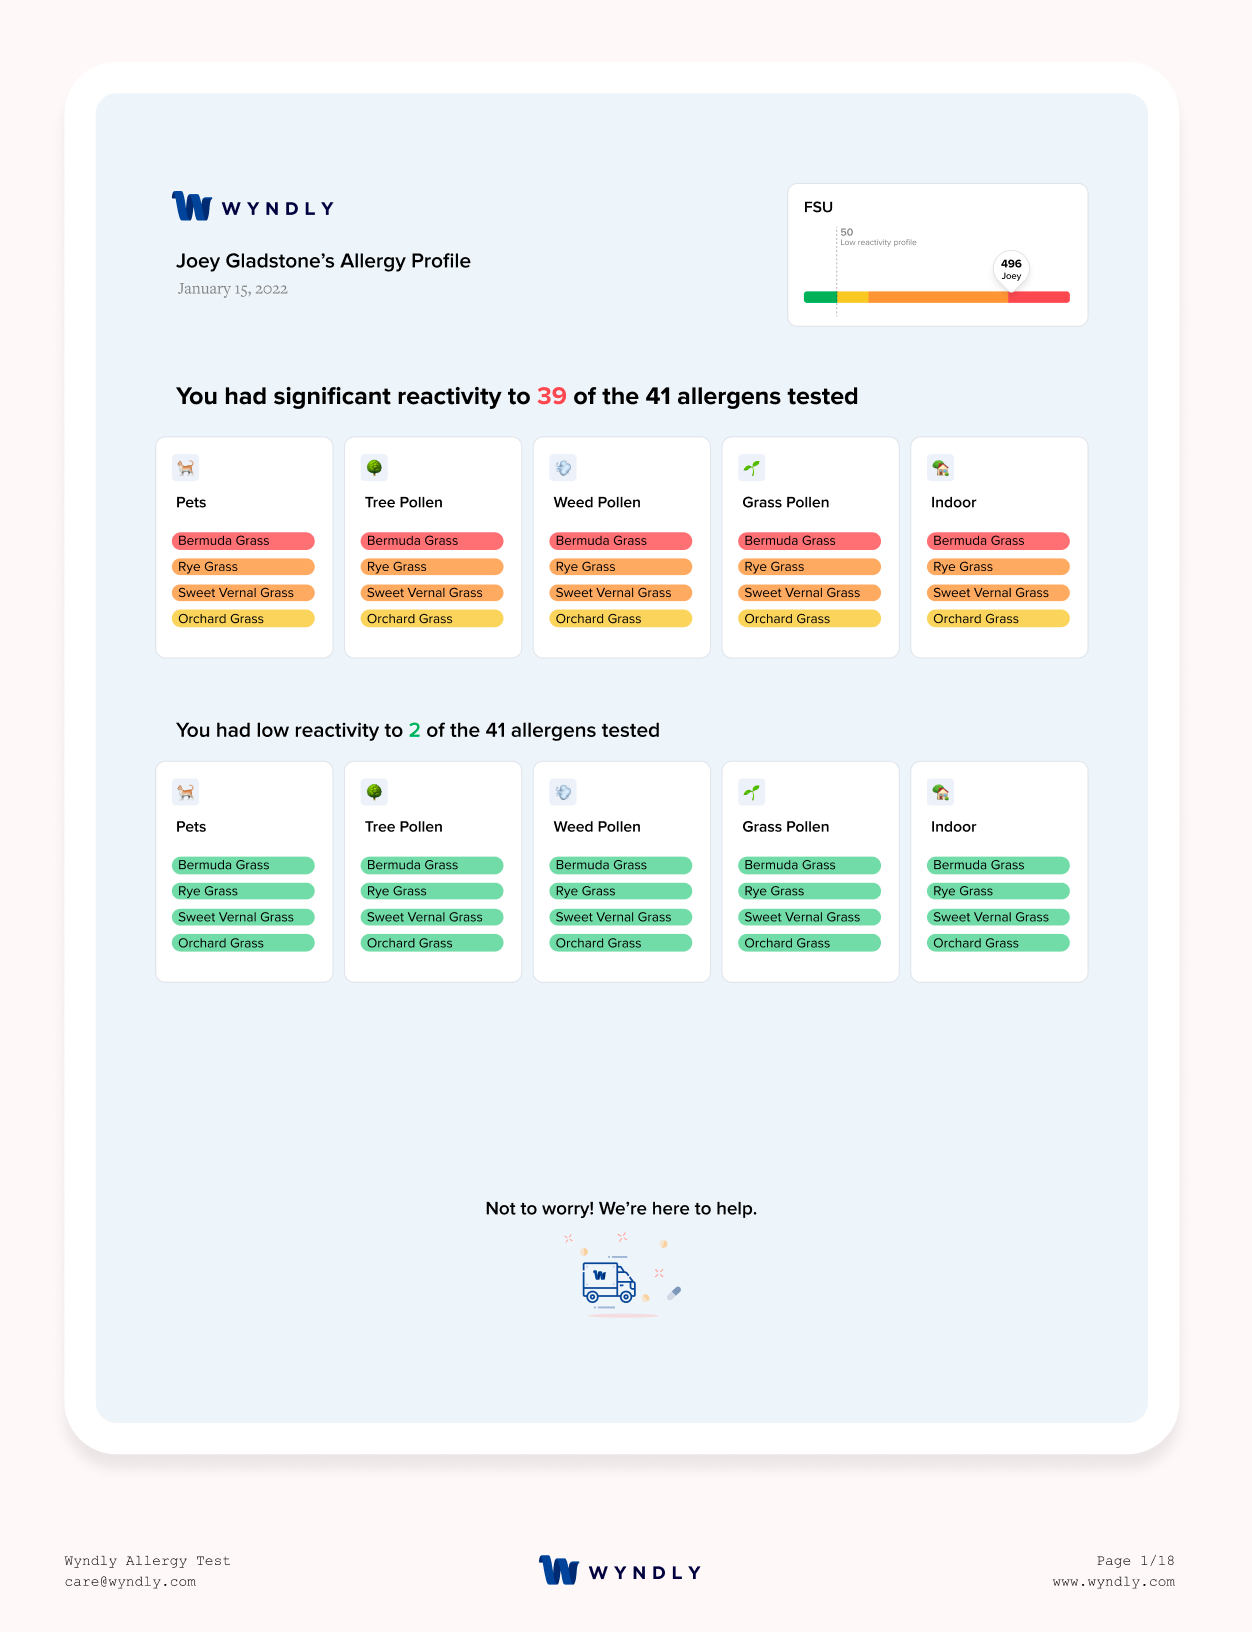
- Take patient’s test results, design and generate user-friendly PDFs explaining results
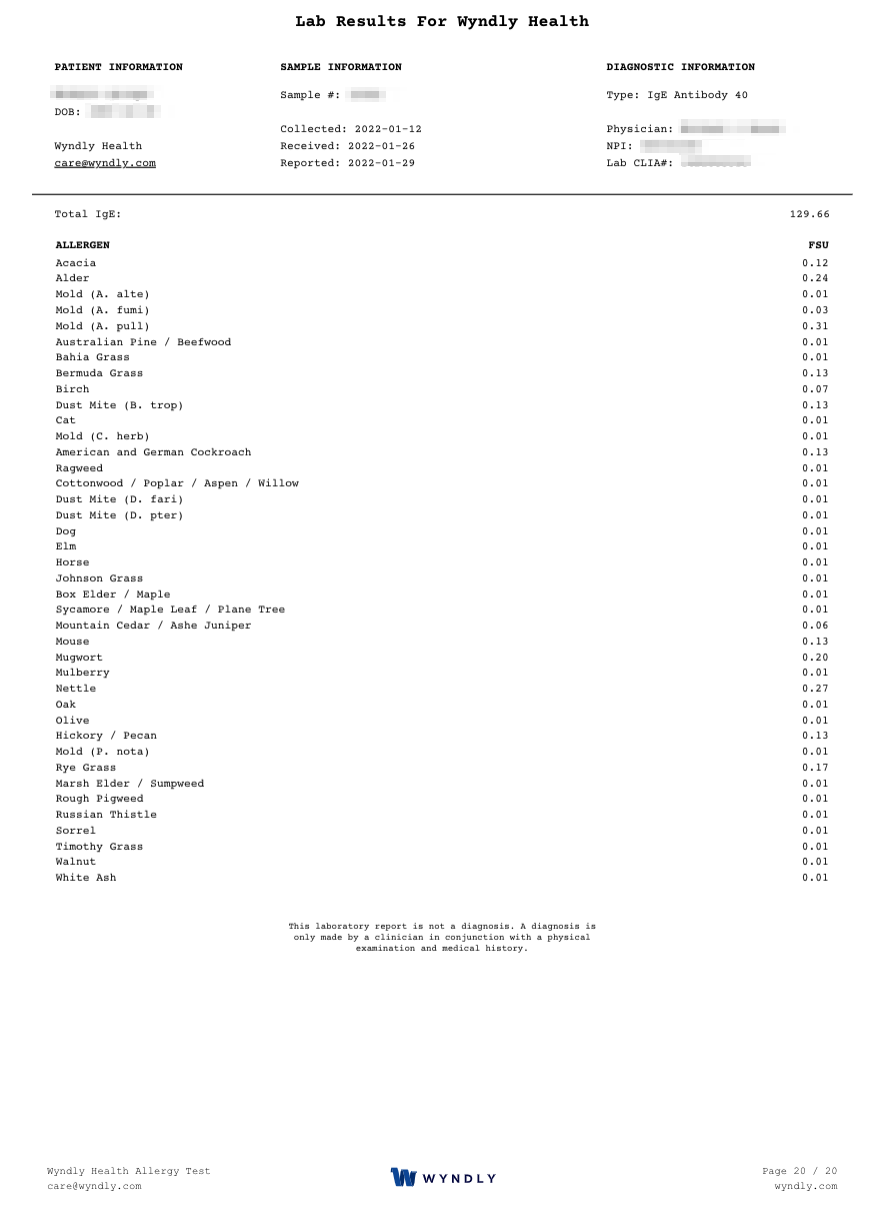
- Additionally, generate doctor-oriented results
- drChrono API and Vital API, Lamdas, Node, Puppeteer, JavaScript, D3, Vue
- Launch in 3 months
- ~ As of late 2023, has been used by 4,000+ patients and generated 2M in revenue
Wyndly, the telehealth allergy company, needed a way to generate and deliver secure allergy test results to prospective patients. Working closely with the CEO and backend engineer, we took the patient data API, designed, and automated with Vue, Node, Mailgun, and remote Lamdas.
This was a fun project!
Medical Results
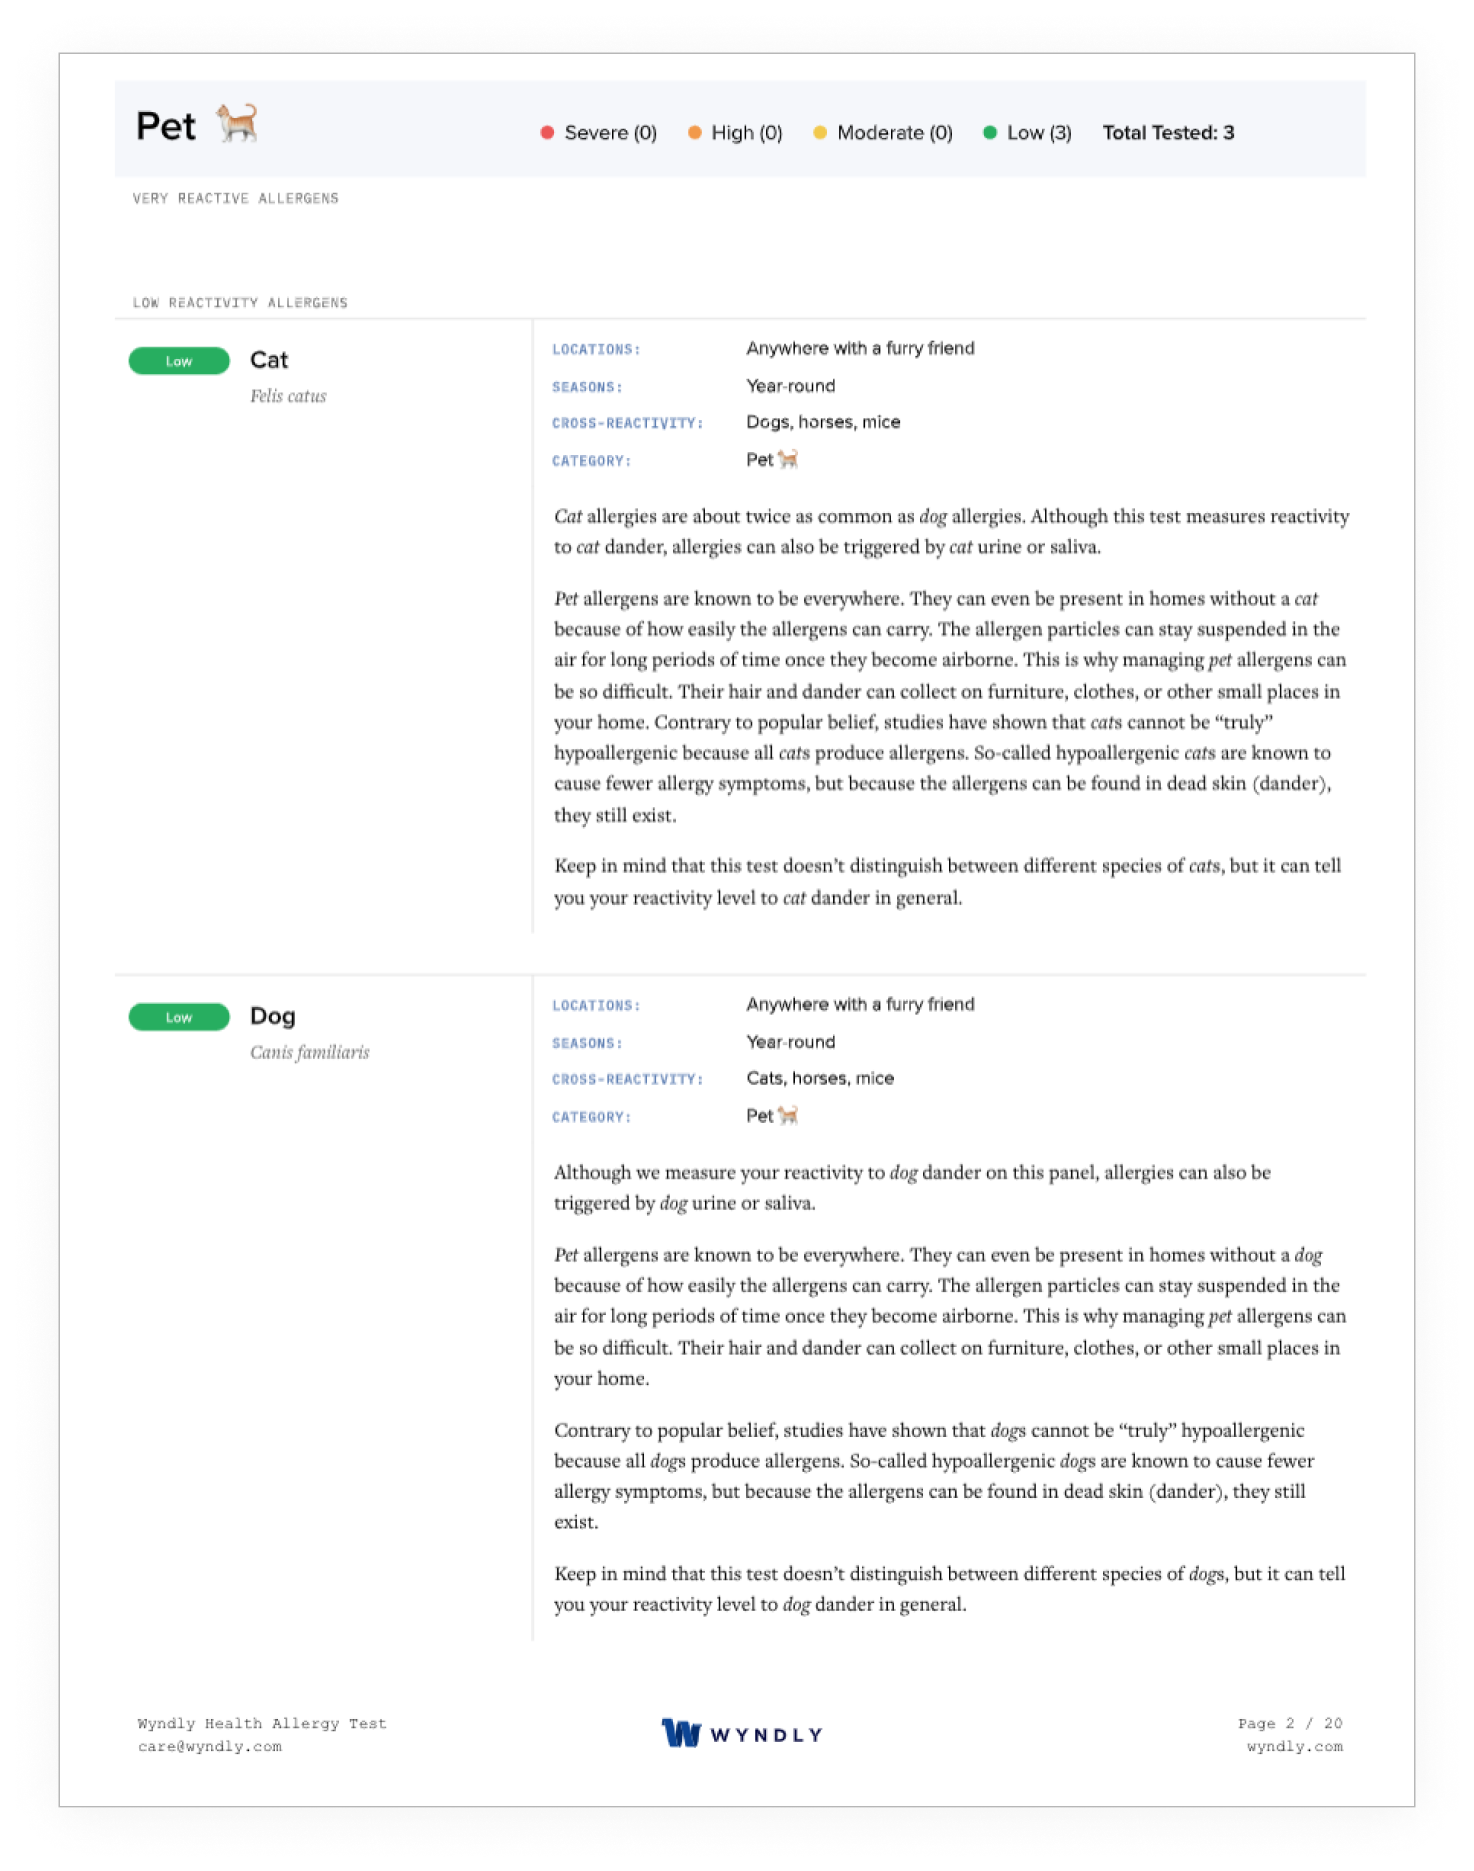
Typically, a patient receiving allergy test results from a hospital gets a doctor-oriented document listing raw IgE results. For this task, we wanted to generate a doctor-oriented PDF result but then expand into a more human report, helping the patient understand their allergy symptoms and information. (To be fully explained by their medical practitioner).
Patient Report
For the patient report, we decided to give a full pollen snapshot then provide in-depth pollen information, tailored to the users' results.
Read more on Wyndly's blog: Process: Sample allergy test report.
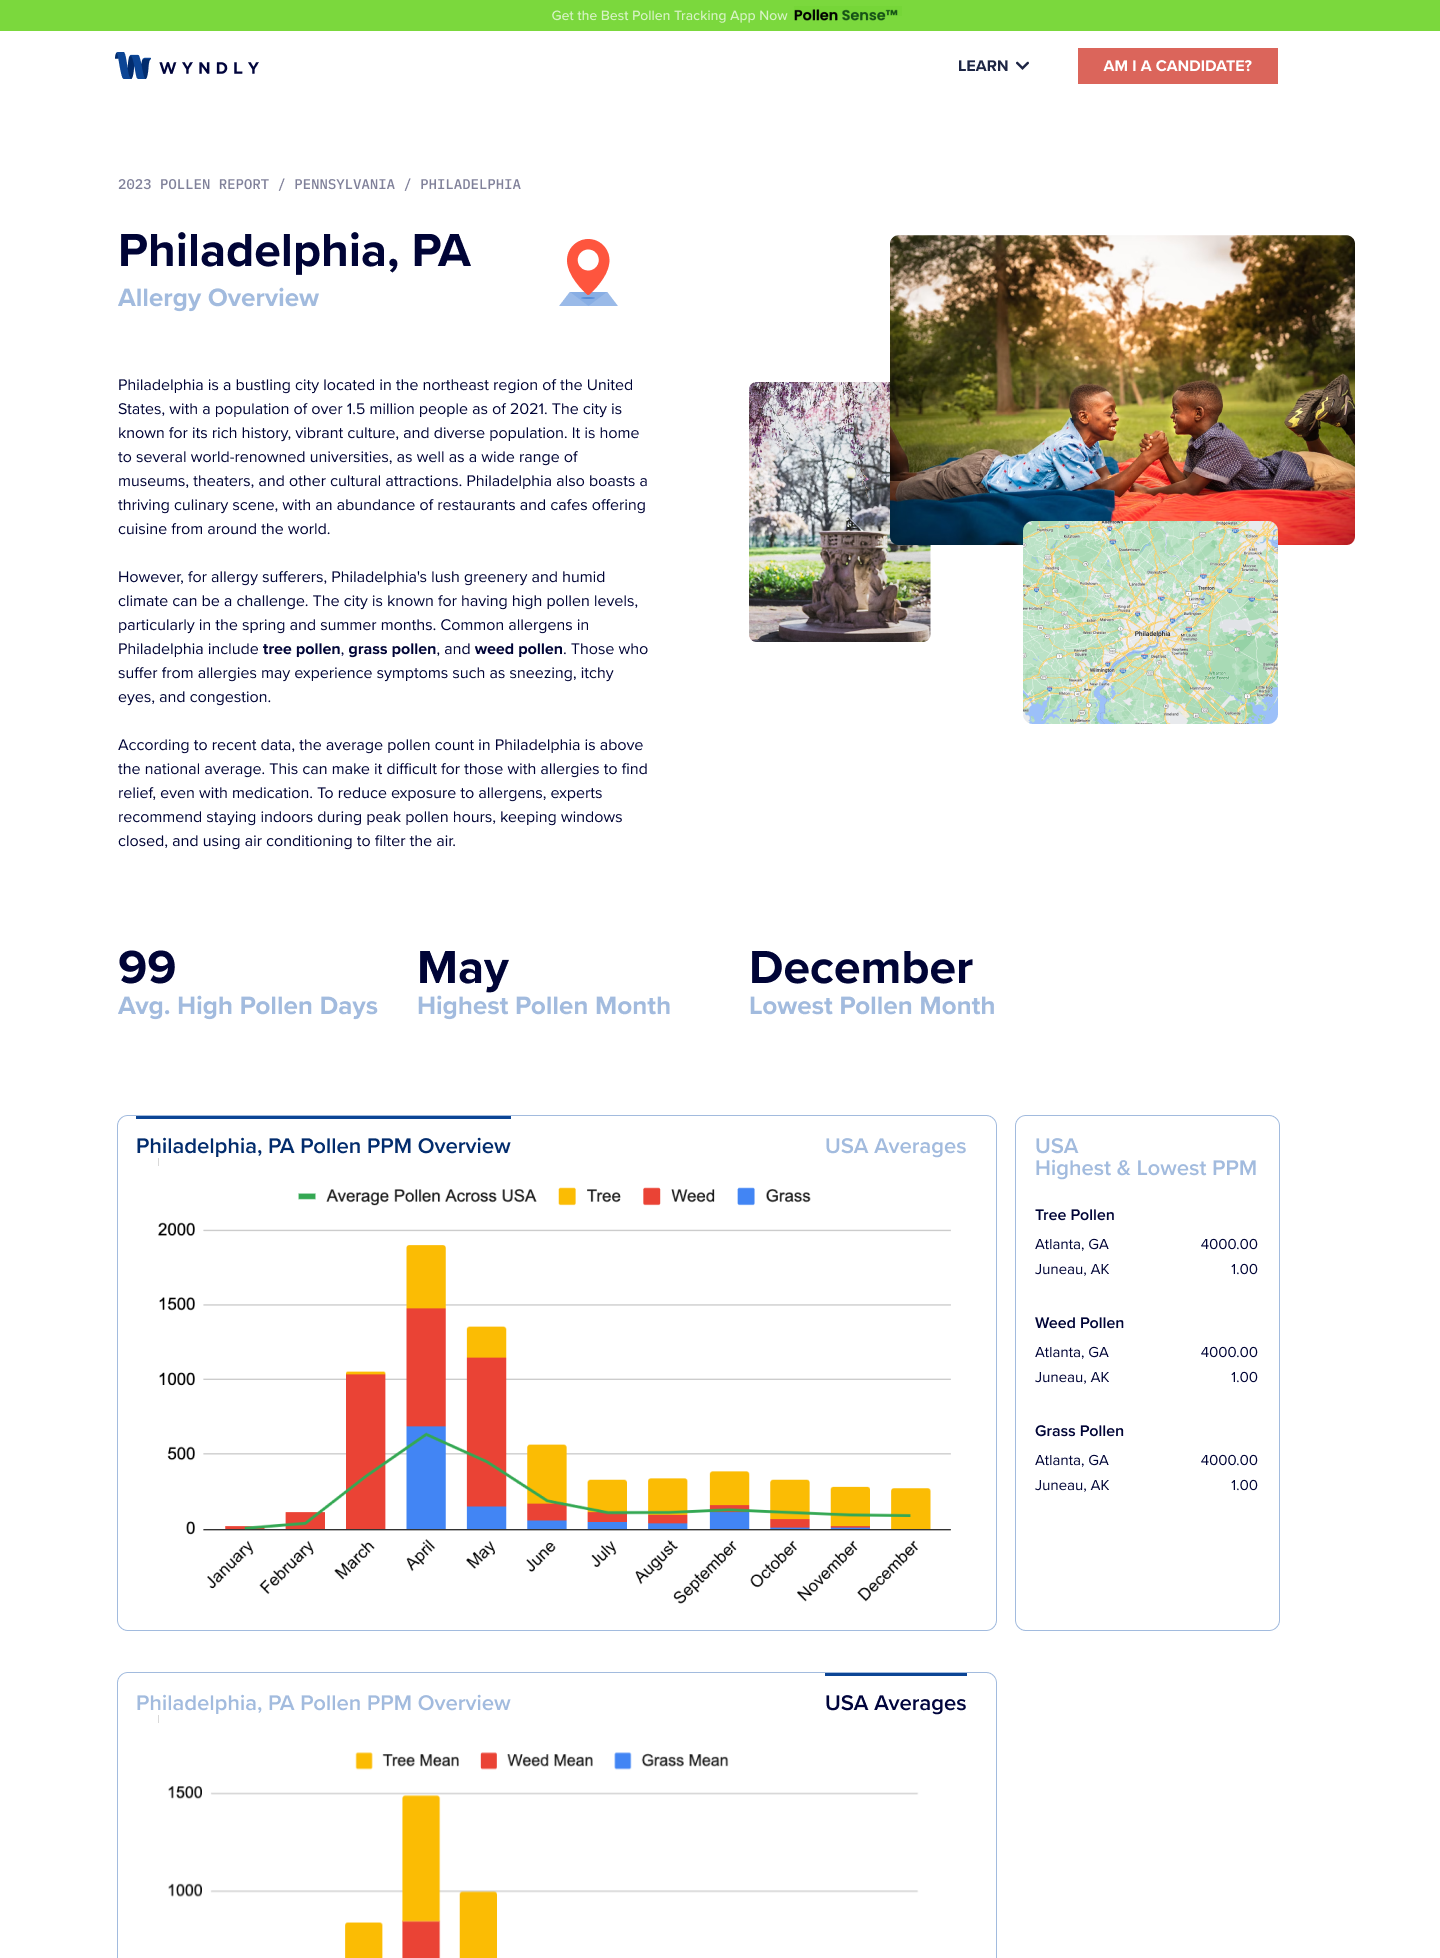
Blog allergy reports driven by PollenSense API data
Target 🎯
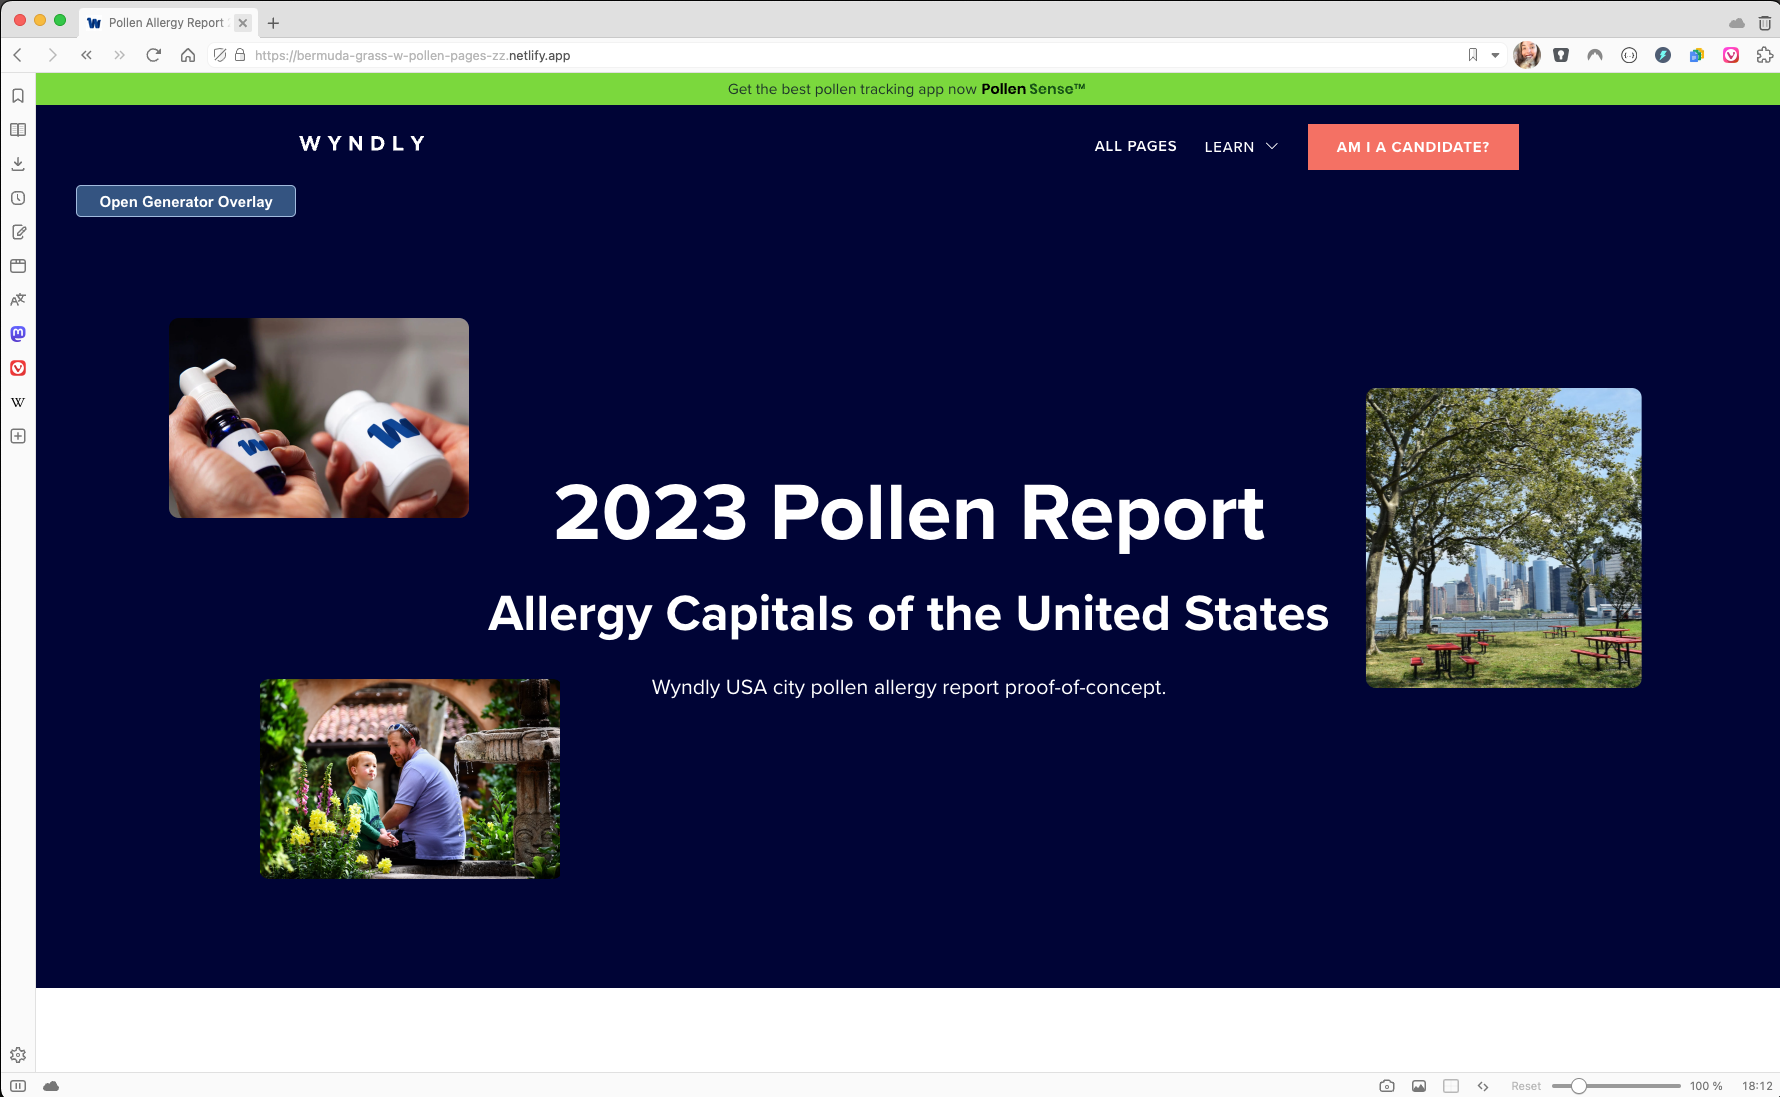
- Take pollen dataset and generate interactive, quality designed, high engagement pages, e.g., Summer Pollen Phoenix, AZ 2023
- Build SEO credibility with long-form niche content
- Ship 350+ pollen USA blog pages (cities, states, permutations)
- JavaScript, Python, Vue, D3, Google Sheets, Netlify
- Hand off to Shopify dev team in CSV and generated format
- Launch in 2.5 months
- ~ Since launch, the reports have generated 6k page views, 3.4k unique visitors, 1:25m of average engaged time
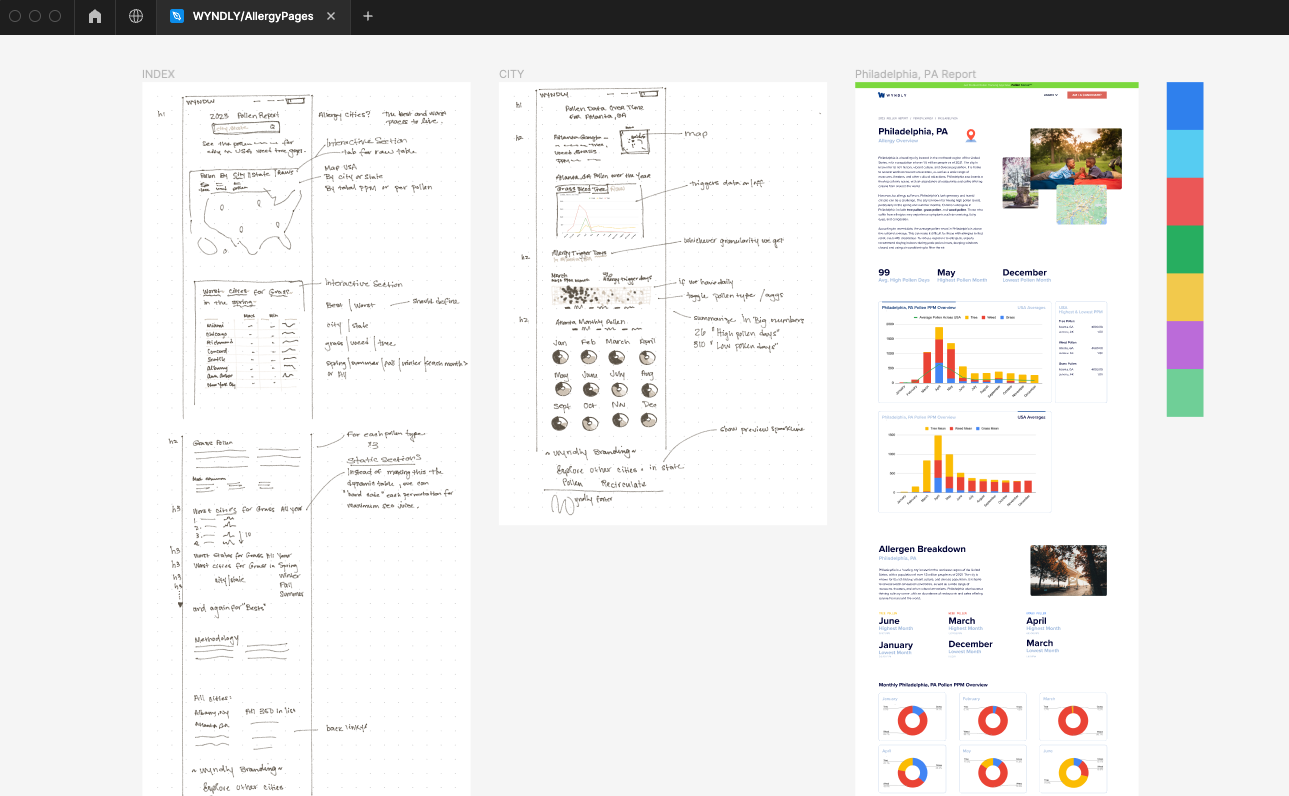
Wyndly needed to design and launch a bunch of generated pages from the PollenSense dataset as location specific allergen breakdowns. Given a set of static pollen data, Wyndly's CEO and I worked to analyze, design, and iterate on these location pollen pages.
