
marguerite.io/vue-d3-dataviz-starter
I love D3.js. It is a fantastic tool used for developing custom charts and interactions while offering full debugging capabilities. The D3 JavaScript library is the industry standard for data visualizations in the browser.
With D3, you can
- Create and scale fully responsive charts (your bar charts, histograms, line charts, scatterplots)
- Prototype intricate graphs (Sankey graphs, radar charts, and much more)
- Parse and clean up data
- Create wholly new and creative interactive experiences
D3’s biggest limitation
The learning curve with D3 is tricky because it is nested in another skill set — web development. This is where I hope this project finds some use.
Other than highlighting datasets around meaningful topics, I wanted to make a repo someone can use, easily clone, run, and start playing around with.
When learning D3 (and frontend in general), I struggled a lot with getting going with various starter repos, especially when React was starting to become more popular. (Eventually, we made this Currents dashboard!)
marguerite.io/vue-d3-dataviz-starterI used React for many years but fell in love with the organization of Vue. It gives you the best of a flexible/modern/quick javascript framework with just enough opinion around component creation. Plus, I find Vite much easier to wrap my head around than Webpack (but I acknowledge Webpack walked so Vite could run).
In this starter
So in here, we have
- Vue 3
- Vite
- D3
- CSV imports
- Coordinate tooltips
- Voronoi tooltips
- Responsive layouts
- Color scales & interpolation
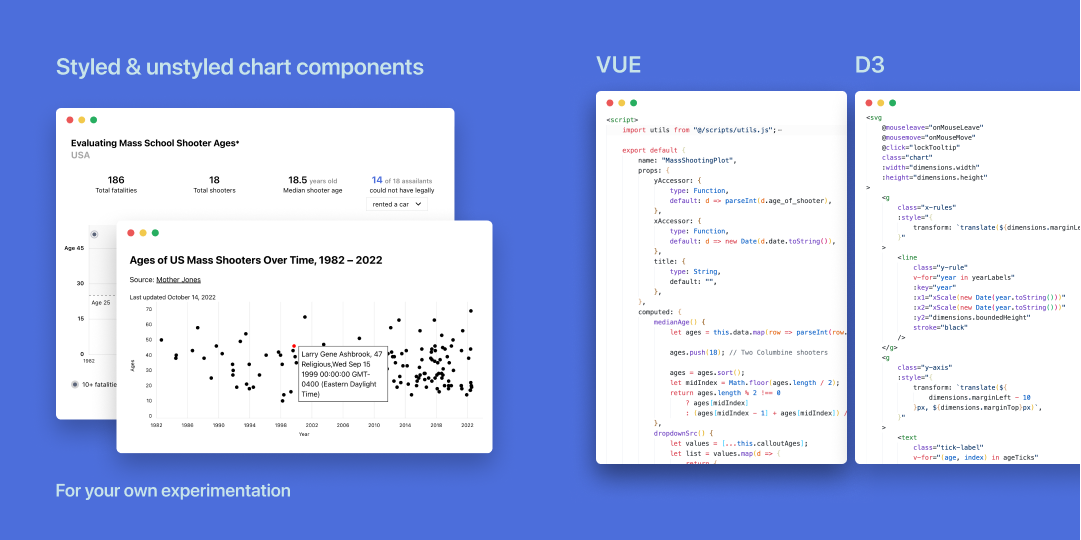
- Styled and unstyled charts
I plan to keep this open-sourced repo going and make little dataviz charts. Both unstyled and styled chart components are included for each chart type, so you can take just the bones and apply them to any other dataset with much less tinkering. 💀
For more D3 and dev resources, check out:
- Post: Set up a local dev environment and run a website in 10 minutes
- Resource: Everything in Amelia Wattenberger. She wrote the book on it!
If none of this has sold you on making graphs, you can delete all those components and use this repo as a Vue3 + Vite seed. I use this for my own site, plus some SSGing before production.
Using this starter
Prerequisite
Install
- Open the terminal and clone this repo:
- Go into that folder via terminal:
- Install the node packages listed in
package.json:
- Run the vite server
- Head to http://localhost:3000/
Dataset sources
Line chart
- Average temperature anomaly mean time series
Scatter plot
- Mass shootings