Emoji style pet.
Loading...

data projects

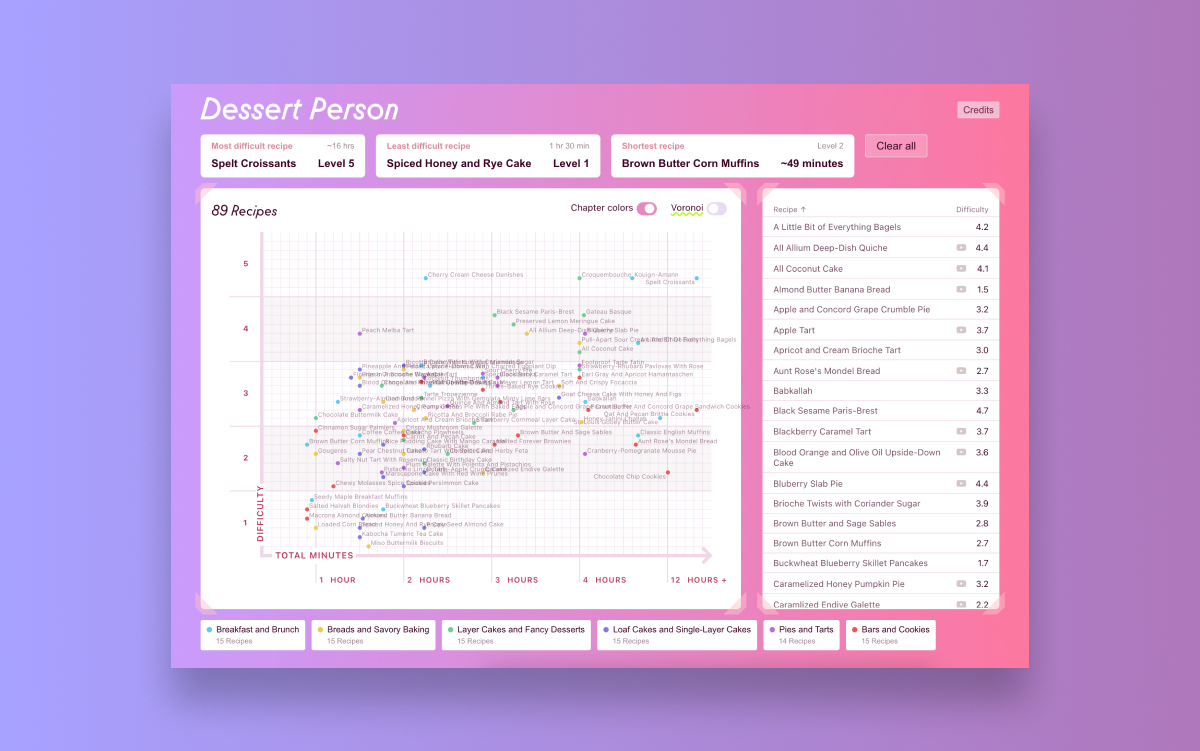
Dessert Person | Interactive Visualization

The Dessert Person cookbook (by Claire Saffitz and designed by Mia Johnson) features this recipe difficulty x cook time scatterplot.

tech
Javascript
Vue
Vite
D3
CSV

Vue + D3 Visualization Starter | Mass Shooters & Global Temps

Here, take some code.

Kicked off as my

June 2022 Rage Projectβ„’
, here is a repo for data visualizations (unstyled visualizations included).

Black lives matter. Abortion is healthcare. Climate change is real. Support prison reform. πŸ™

tech
Javascript
Vue
Vite
D3
CSV
Figma

Evaluating Mass School Shooter Ages
*

USA, 1982 – 2022

0
Total fatalities
1
Total shooters
18 years old
Median shooter age
of 1 assailants
could not have legally
NaN, 0NaN
0 15 30Age 45198219901998200620142022 Year Age 25
10+ fatalities
Displayed violent warning signs
Data period: Aug 02, 1982 – July 17, 2022       Source: Mother Jones
Loading data...

Has the Earth always been this hot?

When were you born?
yes
Monthly Temperature Anomalies Β°C, 1880 – 2022       Source: NOAA

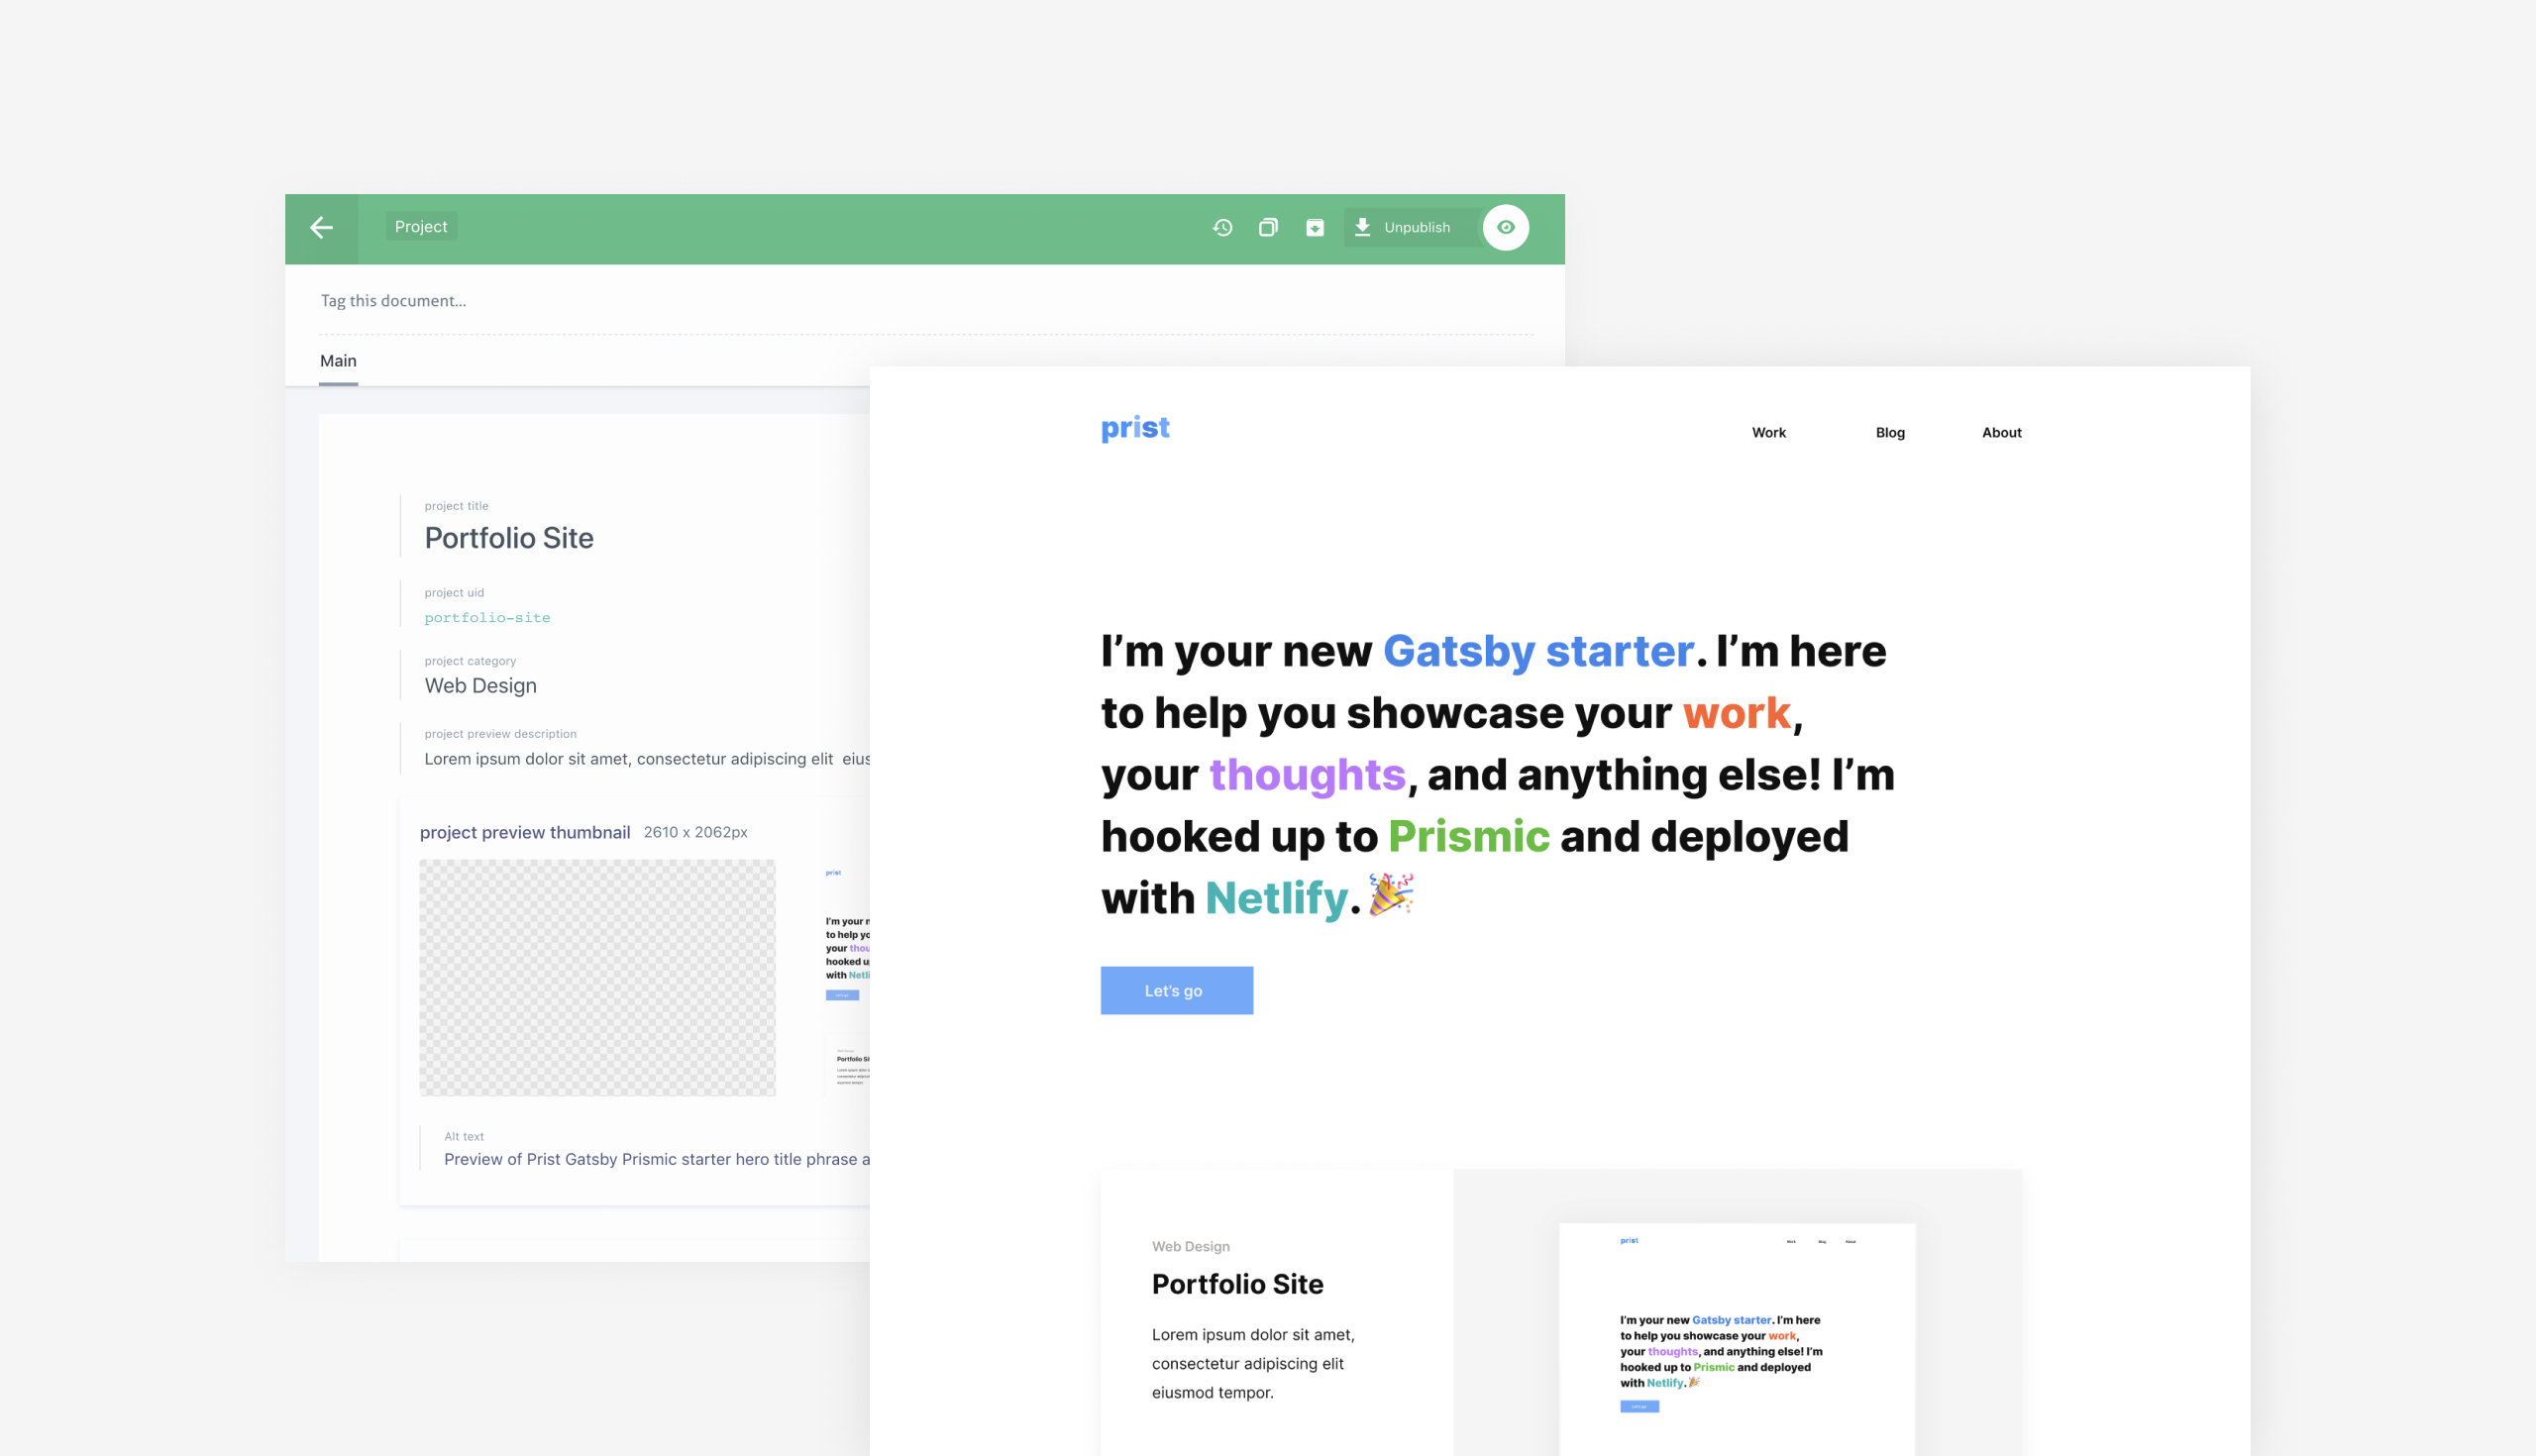
Prist | A Gatsby & Prismic Starter

A light-themed starter powered by Gatsby and Prismic to showcase portfolios and blogs.

Gatsby starter doc

Github
β˜†343

tech
Gatsby 2
React
Prismic CMS
Figma